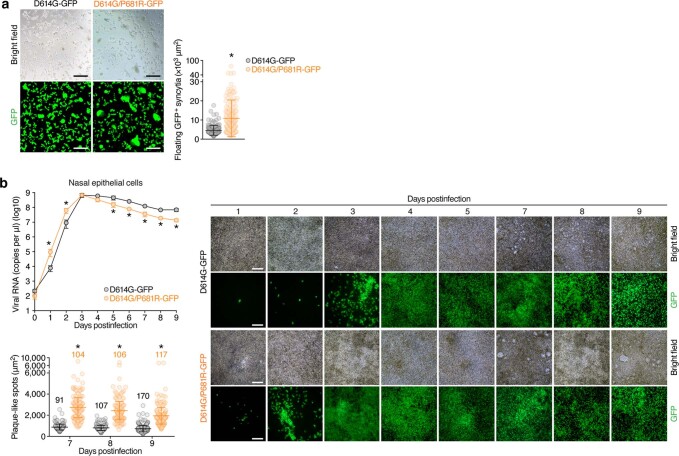
Extended Data Fig. 7. Syncytium formation in VeroE6/TMPRSS2 cells infected with GFP-expressing viruses.
a, (Left) Floating syncytia in VeroE6/TMPRSS2 cells infected with GFP-expressing D614G and D614G/P681R mutant viruses (100 TCID50) at 72 h.p.i. Bars, 100 μm. (Right) The size distributions of adherent GFP+ syncytia in the D614G mutant-infected (n = 147) and the D614G/P681R mutant-infected (n = 171) cultures. b, The GFP-expressing D614G and D614G/P681R mutant viruses (1,000 TCID50) were inoculated on the apical side of culture. (Upper left) The copy number of viral RNA on the apical side was quantified as described in Methods, and the growth curves of the inoculated viruses are shown. (Lower left) The size distributions of plaque-like spots in D614G-infected and D614G/P681R-infected cultures. The numbers in the panel indicate the number of plaque-like spots counted. (Right) Time-course of GFP expression. Note that larger plaque-like spots are observed in D614G/P681R-infected culture after 7 d.p.i. Bars, 200 μm. Assays were performed in quadruplicate. Data are mean ± S.D. Statistically significant differences versus D614G (*P < 0.05) were determined by two-sided, unpaired Student’s t test (b, upper left) or the Mann-Whitney U test (a, b, lower left).

