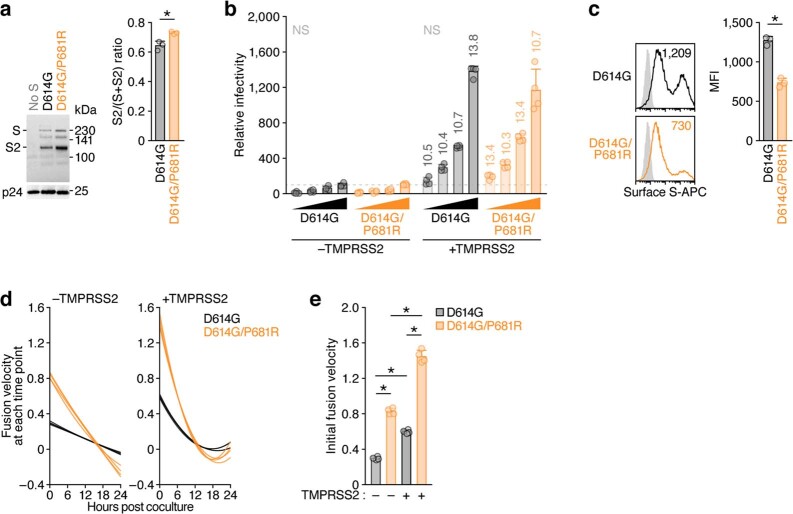
Extended Data Fig. 8. Virological phenotypes exhibited by the P681R mutation.
a, Western blotting of pseudoviruses. (Left) Representative blots of SARS-CoV-2 full-length S and cleaved S2 proteins as well as HIV-1 p24 capsid as an internal control. kDa, kilodaltons. (Right) The ratio of S2 to the full-length S plus S2 proteins on pseudovirus particles. Assays were performed in triplicate. Data are mean ± S.D. A statistically significant difference (*, P < 0.05) versus D614G S was determined by two-sided Student’s t test. b, Pseudovirus assay. The HIV-1-based reporter virus pseudotyped with SARS-CoV-2 S D614G or D614G/P681R was inoculated into HOS-ACE2 cells or HOS-ACE2/TMPRSS2 cells at 4 different doses (125, 250, 500 and 1,000 ng HIV-1 p24 antigen). Rates of infectivity compared to the virus pseudotyped with parental S D614G (1,000 ng HIV-1 p24) in HOS-ACE2 cells are shown. The labels above the HOS-ACE2/TMPRSS2 bars indicate the fold change versus the corresponding HOS-ACE2. Assays were performed in quadruplicate. c, Expression of S protein on the cell surface. (Left) Representative histogram of S protein expression on the cell surface. The number in the histogram indicates the mean fluorescence intensity (MFI). (Right) The MFI of surface S on the S-expressing cells. Assays were performed in triplicate. d,e, The kinetics of fusion velocity. d, Fitting of a mathematical model based on the kinetics of fusion activity data (see Methods). Each line indicates the result of respective mathematical model on the experimental data (shown in Fig. 3e). e, Initial velocity of the S-mediated fusion. Assays were performed in quadruplicate. Data are mean ± S.D. Statistically significant differences (*P < 0.05) were determined by two-sided, unpaired Student’s t test without adjustments for multiple comparisons (b), two-sided Student’s t test (c) or two-sided Welch’s t test (e). NS, no statistical significance.

