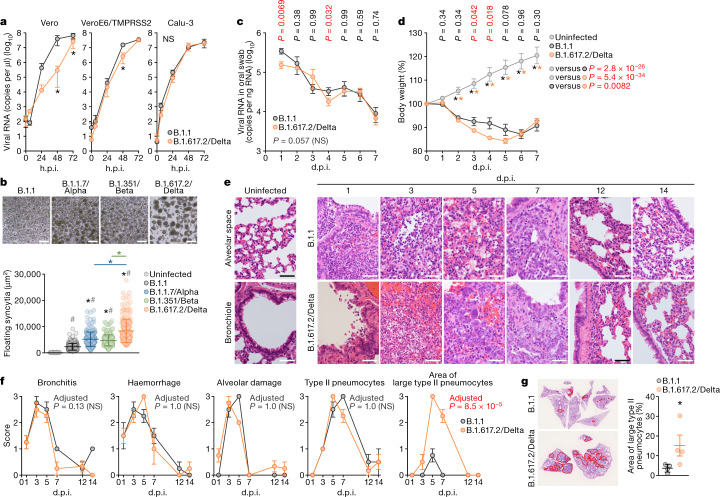
Fig. 2. Virological features of the B.1.617.2/Delta variant in vitro and in vivo.
a, Growth kinetics of B.1.617.2/Delta variant. A B.1.617.2/Delta and a D614G-bearing B.1.1 were inoculated in cells, and the copy number of viral RNA in the supernatant was quantified using RT–qPCR. Assays were performed in quadruplicate. b, Syncytium formation. Top, representative bright-field images of VeroE6/TMPRSS2 cells at 72 h.p.i. Scale bars, 100 μm. Bottom, the size distributions of floating syncytia in the cultures infected with B.1.1 (n = 215), B.1.1.7/Alpha (n = 199), B.1.351/Beta (n = 249) and B.1.617.2/Delta (n = 216). The size distribution of the floating uninfected cell culture (n = 177) is also shown as a negative control. c–g, Infection of Syrian hamsters with the B.1.617.2/Delta variant. Syrian hamsters were intranasally inoculated with B.1.1 (n = 6) and B.1.617.2/Delta (n = 12). Four hamsters of the same age were mock infected. The amount of viral RNA in the oral swab (c) and body weight (d) were measured. e, Haematoxylin and eosin (H&E) staining of the lungs of infected hamsters. Uninfected lung alveolar space and bronchioles are shown (left). Scale bars, 50 μm. f, Histopathological scoring of lung lesions. Representative pathological features are shown in Extended Data Fig. 5a. g, The area with large type II pneumocytes in the lungs of B.1.1-infected (n = 4) and B.1.617.2/Delta-infected (n = 4) hamsters at 5 d.p.i. The area was measured on the photographs (left) and summarized (right, each dot indicates the result from respective hamster). Raw data are shown in Extended Data Fig. 5b. Data are mean ± s.d. (a, b) or mean ± s.e.m. (d, f, g). In a, b, g, statistically significant differences versus B.1.1, B.1.1.7/Alpha and B.1.351/Beta (*P < 0.05) and uninfected culture (#P < 0.05) were determined using two-sided, unpaired Student’s t-tests (a, g) or Mann–Whitney U-tests (b). In c, d, f, statistically significant differences between B.1.1 and B.1.617.2/Delta were determined by multiple regression and P values (c, d), and family-wise error rates calculated using the Holm method (f) are indicated in the figure. Statistically significant differences at each timepoint were also determined using two-sided unpaired Student’s t-tests without adjustment for multiple comparisons (c, d), and those versus uninfected hamsters (*P < 0.05) are indicated by asterisks. The P value of the comparison between B.1.1 and B.1.617.2/Delta at each d.p.i. is indicated in the figure. NS, not significant.

