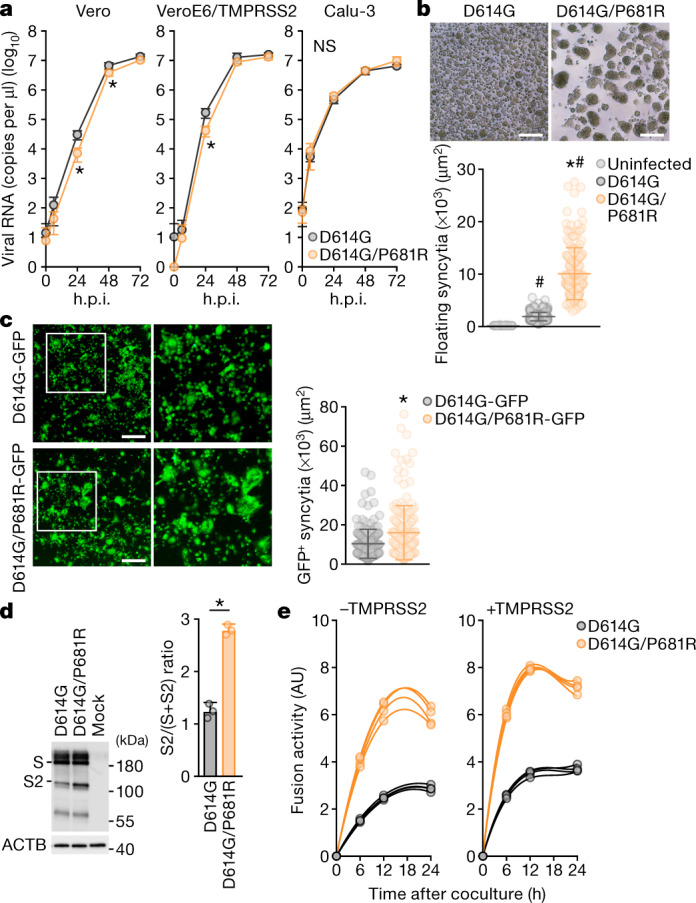
Fig. 3. Virological features of the P681R-containing virus in vitro.

a, The growth kinetics of artificially generated viruses. The D614G and D614G/P681R mutant viruses were generated by reverse genetics. These viruses (100 tissue culture infectious dose (TCID50)) were inoculated into Vero cells and VeroE6/TMPRSS2 cells, and the copy number of viral RNA in the culture supernatant was quantified using RT–qPCR. The growth curves of the inoculated viruses are shown. Assays were performed in quadruplicate. b, c, Syncytium formation. b, Floating syncytia in VeroE6/TMPRSS2 cells infected with the D614G and D614G/P681R mutant viruses at 72 h.p.i. (top). Scale bars, 200 μm. Bottom, the size distributions of floating syncytia in D614G-infected (n = 228) and D614G/P681R-infected (n = 164) cultures. c, Adherent syncytia in VeroE6/TMPRSS2 cells infected with GFP-expressing D614G- and D614G/P681R-mutant viruses at 24 h.p.i. Higher-magnification views of the regions indicated by with squares are shown in the right images. Scale bars, 200 μm. The size distributions of adherent GFP+ syncytia in the D614G-infected (n = 111) and D614G/P681R-infected (n = 126) cultures. d, Western blot analysis of S-expressing cells. Left, representative blots of SARS-CoV-2 full-length S and cleaved S2 proteins as well as ACTB as an internal control. Assays were performed in triplicate. Data are mean ± s.d. Right, the ratio of S2 to the full-length S plus S2 proteins in the S-expressing cells. e, SARS-CoV-2 S-based fusion assay. Effector cells (S-expressing cells) and target cells (ACE2-expressing cells or ACE2/TMPRSS2-expressing cells) were prepared, and the fusion activity was measured as described in the Methods. Assays were performed in quadruplicate, and fusion activity (arbitrary units) is shown. Data are mean ± s.d. Statistically significant differences versus D614G (*P < 0.05) and uninfected culture (#P < 0.05) were determined using two-sided unpaired Student’s t-tests (a, d) or Mann–Whitney U-tests (b, c).
