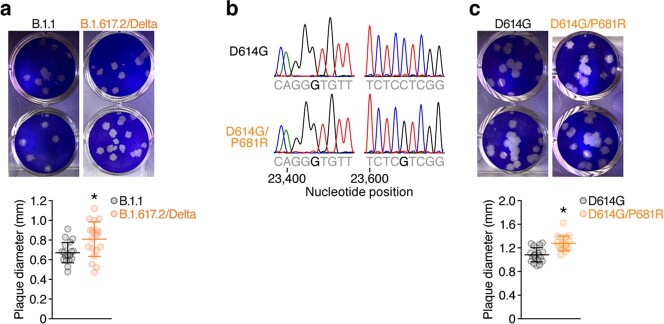
Extended Data Fig. 2. Plaques of SARS-CoV-2-infected VeroE6/TMPRSS2 cells.
a, A plaque assay was performed using VeroE6/TMPRSS2 cells as described in Method. Representative figures (top) and the summary of the size of plaques (n = 20 for each virus) are shown. Each dot indicates the diameter of the respective plaque. b, Chromatograms of nucleotide positions 23,399-23,407 (left) and 23,600-23,608 (right) of parental SARS-CoV-2 (strain WK-521, PANGO lineage A; GISAID ID: EPI_ISL_408667) and the D614G (A23403G in nucleotide) and P681R (C23604G in nucleotide) mutations. c, A plaque assay was performed using VeroE6/TMPRSS2 cells as described in Method. Representative figures (top) and the summary of the size of plaques (n = 20 for each virus) are shown. Each dot indicates the diameter of the respective plaque. Data are mean ± S.D (a, c). Statistically significant differences between B.1.1 and B.1.617.2/Delta (a, *P < 0.05) and between D614G and D614G/P681R (c, *P < 0.05) were determined by two-sided Mann-Whitney U test.

