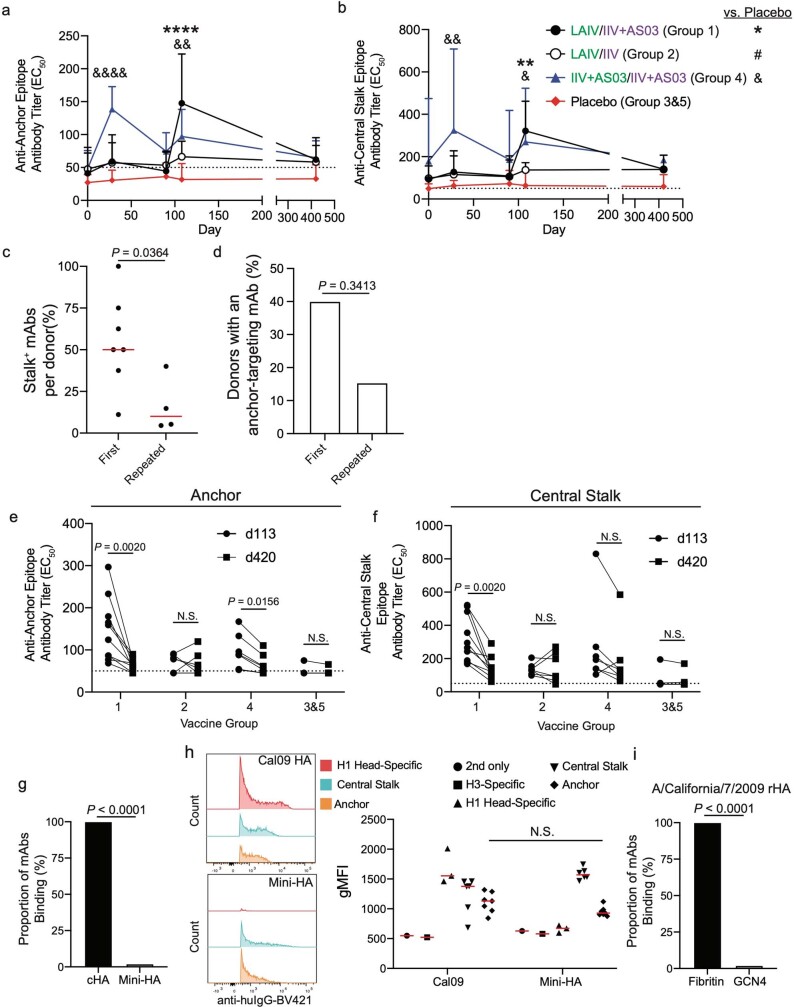
Extended Data Fig. 6. Serum antibody kinetics of anchor- and CS-epitope binding antibodies after cHA vaccination and mAb binding to recombinant HAs. Related to Fig. 4.
a, b, EC50s of serum antibodies competing for binding with 047-09 4F04 for binding to the anchor epitope (a) and CR9114 for binding to the CS epitope (b). a, b, Kinetics of serum antibody responses against the anchor (a) and CS (b) epitopes. Data are mean + S.D. c, d, Proportion of stalk+ mAbs per donor (c) or proportion of donors with an isolated anchor mAb (d) upon first exposure to the pH1N1 virus (2009 MIV cohort) relative to donors who have repeatedly been exposed to pH1N1 (2010 TIV and 2014 QIV). Data in c are mean ± S.D. Data in c includes only donors with an isolated anti-stalk mAb, whereas d includes all donors. e, f, Antibody titers (EC50) of serum antibodies collected on day 113 and day 420 against the anchor epitope (e) and the CS epitope (f). Lines connect titers from the same donor and each pair of symbols represents one donor. g, Proportion of anchor epitope-binding mAbs binding to cHA (cH6/1) or mini-HA (n = 50). h, Representative flow cytometry plots of mAbs binding to A/California/7/2009 Cal09 HA and mini-HA (left) and geometric mean fluorescence intensity (gMFI) of mAbs binding to Cal09 and mini-HA (right). Data represent the mean ± S.D. and each symbol represents an individual mAb. i, Proportion of anchor epitope-targeting mAbs binding to A/California/7/2009 recombinant HA with a GCN4 or fibritin trimerization domain (n = 50). For data in a, b, e, and f, Group 1 n = 10 participants, group 2 n = 7 participants, group 4 n = 7 participants, group 3&5 n = 6. For data in c, first exposure n = 7 donors and repeated exposure n = 4 donors. For data in d, first exposure n = 10 donors and repeated exposure n = 13 donors. Data in a, b were analyzed using a two-tailed two-way ANOVA testing for simple effects within rows, data in c and h were analyzed using a two-tailed unpaired non-parametric Mann-Whitney test, data in d, g, and i were analyzed using Fisher’s Exact test, and data in c, d were analyzed using a two-tailed paired non-parametric Wilcoxon matched-pairs signed rank test. See also Supplementary Fig. 1 for gating strategy for panel h.

