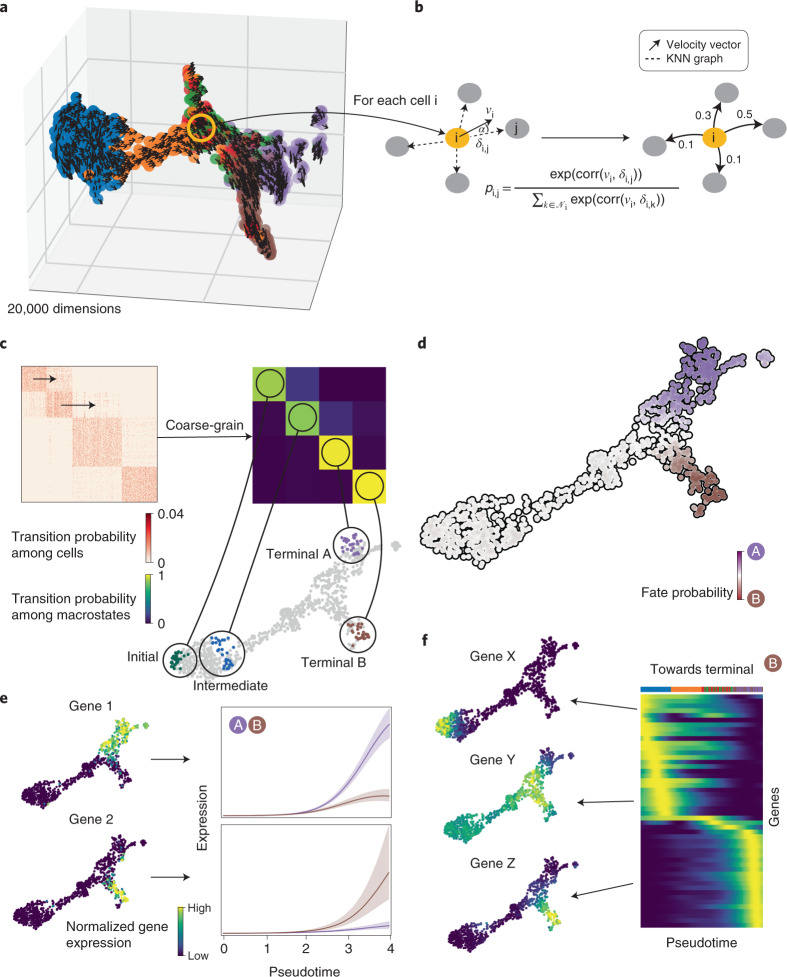
Fig. 1. Combining RNA velocity with cell–cell similarity to determine initial and terminal states and compute a global map of cellular fate potential.
a, 3D UMAP of 1,000 simulated cells with their velocity vectors, using DynGen66. Colors reflect DynGen ground truth branch assignment. CellRank models cell state transitions directly in high-dimensional gene expression space. b, A reference cell i with velocity vector vi and its nearest neighbors. The vector δi,j is the difference in gene expression between cells j and i. To assign probability pi,j to cell i transitioning to cell j in the neighborhood Ni of cell i, we transform correlations between the transcriptomic difference vectors δi,j and the velocity vector vi, essentially considering the angle α between these vectors. c, The directed transition matrix is coarse-grained into four macrostates. Heatmaps show transition probabilities among cells (left) and macrostates (right); sorting cells according to macrostate membership recovers block structure in the cell–cell transition matrix. We recover initial, intermediate and two terminal states. The 30 colored cells are mostly likely to belong to each macrostate in the UMAP. d, For each cell, we compute its probability of reaching A or B. We show these fate probabilities in a fate map, where each cell is colored according to the terminal state it is most likely to reach. Color intensity reflects the degree of lineage priming. e, Using these fate probabilities and a pseudotime, we plot gene expression trends, which are specific to either A or B. Left, each cell is colored based on the expression of the indicated genes; right, respective trends along pseudotime towards each fate. f, Expression trends in pseudotime of the top 50 genes whose expression correlates best with the probability of reaching B in a heatmap. Genes have been sorted according to their smoothed peak in pseudotime. One early gene (X), one intermediate gene (Y) and one late gene (Z) are highlighted by showing expression in the UMAP.

