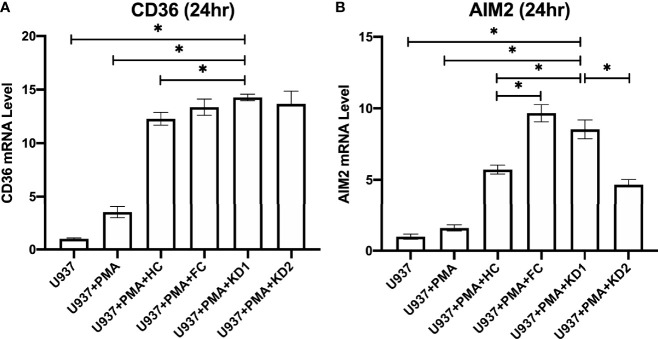
Figure 5.
Comparison of relative CD36 and AIM2 mRNA expression in U937-derived macrophages after stimulation with patient plasma. (A) Relative CD36 mRNA expression levels in U937 cell cultures (n=3, mean ± SEM 1 ± 0.08), U937 cells stimulated with PMA (n=3, mean ± SEM 3.49 ± 0.52), U937 cells stimulated with PMA and plasma from healthy patients (n=10, mean ± SEM 12.27 ± 0.59), U937 cells stimulated with PMA and plasma from KD patients 24 hours prior to IVIG therapy (n=10, mean ± SEM 14.26 ± 0.31), and U937 cells stimulated with PMA and plasma from KD patients 21 days after IVIG therapy (n=10, mean ± SEM 13.66 ± 1.19). (B) Relative AIM2 mRNA expression levels in U937 cell cultures (n=3, mean ± SEM 1 ± 0.18), U937 cells stimulated with PMA (n=3, mean ± SEM 1.60 ± 0.22), U937 cells stimulated with PMA and plasma from healthy patients (n=10, mean ± SEM 5.72 ± 0.31), U937 cells stimulated with PMA and plasma from KD patients 24 hours prior to IVIG therapy (n=10, mean ± SEM 8.55 ± 0.65), and U937 cells stimulated with PMA and plasma from KD patients and 21 days after IVIG therapy (n=10, mean ± SEM 4.67 ± 0.36). An asterisk denotes a p-value of less than 0.05. HC, Healthy control; KD1, KD prior to IVIG; KD2, KD after IVIG.

