Figure 7.

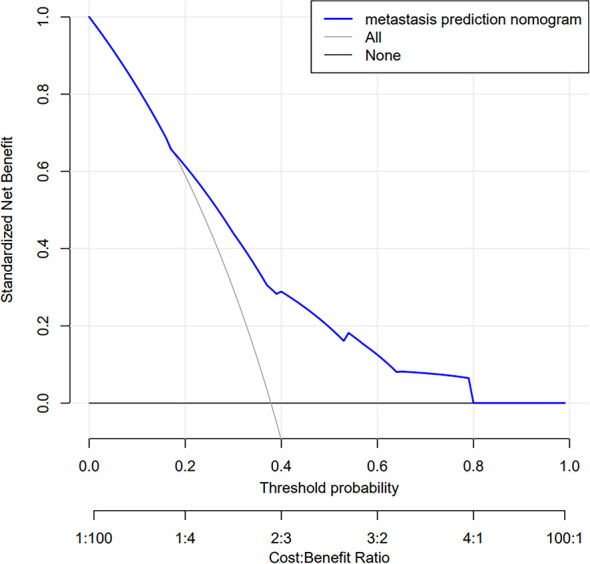
Decision curve analysis (DCA) for the risk nomogram. DCA shows that the model is clinically useful when intervention is decided in the threshold range of 16% to 80%.

Decision curve analysis (DCA) for the risk nomogram. DCA shows that the model is clinically useful when intervention is decided in the threshold range of 16% to 80%.