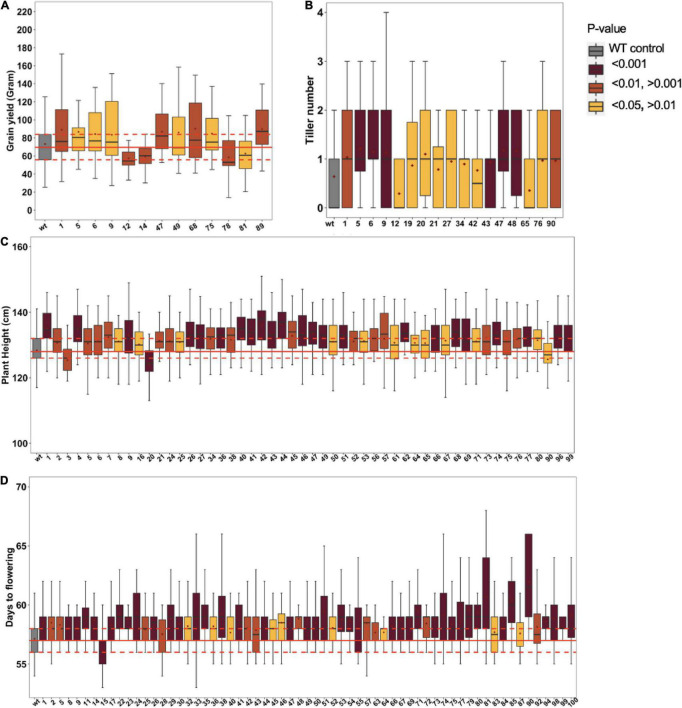
FIGURE 2.
Phenotypic variation in Epi-F2 lines. Boxplot diagrams of epi-F2 lines significantly different from wild-type Tx430 for (A) grain yield, where the least squares mean of each line was computed and a linear mixed-effect model was used for pairwise comparisons between each F2 line and the wild type; (B) tiller number, where the least squares mean of each line was computed and a Poisson model with log link was used for pairwise comparisons between each F2 line and the wild type; (C) plant height, where the least squares mean of each line was computed and a linear mixed-effect model was used to make pairwise comparisons between each F2 line and the wild type; and (D) days to flowering, where the least squares mean of each line was computed and a GAMMA model was used to make pairwise comparisons between each F2 line and the wild type. WT data are from 6650 Tx430 WT plants and 4502 Tx430 WT × Tx430 WT F2 plants. We pooled the Tx430 WT and Tx430 WT × Tx430 WT F2 data, since there was no significant difference between the two types of controls. Epi-F2 data are from the progeny derived from multiple individual WT crosses to msh1 Epi-F1 plants.

