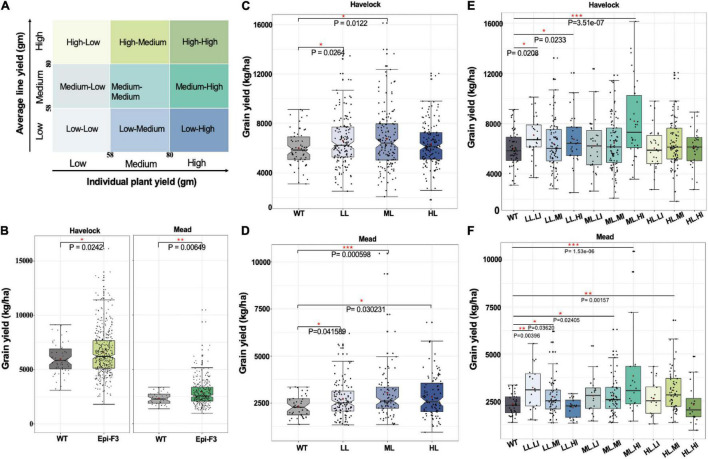
FIGURE 3.
Epi-F3 field testing of selection strategies. (A) Grain yield was used as the desired trait in the selection experiment. Each epi F2 line from the field trial from previous year was classified into three groups based on the line yield mean of the 30th and 70th percentiles of wild-type grain yield for low (line yield mean <58), medium (58 ≤ line yield mean ≤ 80), and high (line yield mean >80). The same cutoffs were used to classify each individual plant in every line into three categories (low, medium, and high), with the combination giving nine categories in total. Three putative selection strategies included (1) unselected, (2) selected based on line mean, and (3) selected based on line mean and individual selection, to be tested in the epi-F3 field trial. (B) A total of 150 epi-F3 and 19 wild-type lines were tested in the field with a 13 × 13 lattice (incomplete block) design, with 3 replications at Lincoln, NE, and 2 replications at Mead, NE. Grain yield (kg/ha; calculated at 140 g kg–1 moisture content) of all 150 epi-F3 lines in each location were compared to WT. (B) Shows the outcome of selection strategy 1, unselected. (C) Grain yield in kg/ha of all the WTs compared to the epi-F3 groups, with selection based on line mean (LL, low line mean; ML, medium line mean; HL, high line mean) at Havelock. (D) Line mean selection results at the Mead location. (E) Grain yield (kg/ha) of all the WTs compared to the epi-F3 groups with selection based on line mean and individual selection (LL.LI, low line mean, low individual; LL.MI, low line mean, medium individual; LL.HI, low line mean, high individual; ML.LI, medium line mean, low individual; ML.MI, medium line mean, medium individual; ML.HI, medium line mean, high individual; HL.LI, high line mean, low individual; HL.MI, high line mean, medium individual; HL.HI, high line mean, high individual) at Havelock. (F) Line mean and individual selection at Mead, NE. The least squares mean of each line was computed and a linear mixed-effect model was used for pairwise comparisons between each F3 line and the wild type. *p-value < 0.05, **0.001 < p-value < 0.01, ***p-value < 0.001.

