FIGURE 4.
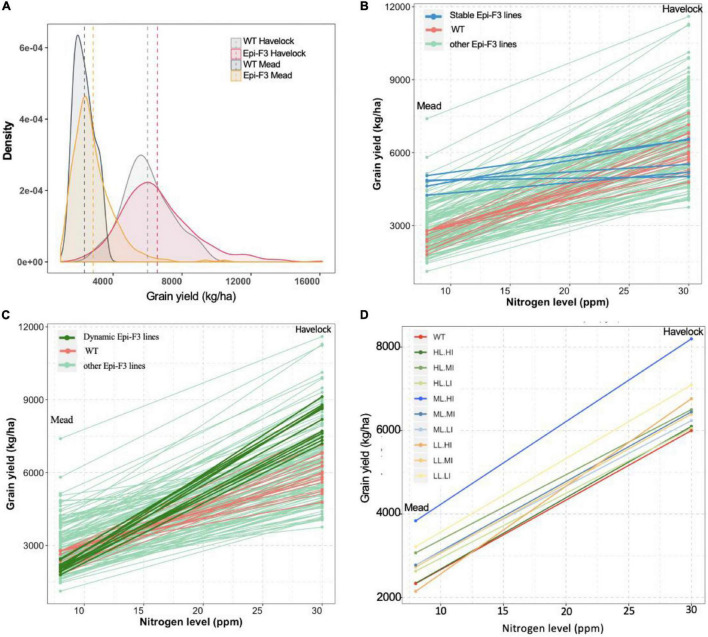
Epi-F3 line resilience in response to low nitrogen was assessed. (A) Grain yield density plot of the WT and epi-F3 lines under normal nitrogen (Havelock, 30 ppm of nitrogen) and low nitrogen (Mead, 8 ppm of nitrogen) conditions. (B,C) Grain yield for the 150 epi-F3 lines and 19 wild-type lines, with each line in the plot representing one line, in the Havelock and Mead locations. “Stable” epi-F3 lines (epi-line yield differential <30%) are highlighted in blue in (B). “Dynamic” epi-F3 lines (epi-line yield differential >30%) are highlighted in dark green in (C). (D) Grain yield differentials of the nine categories for selection based on line mean and individual selection (LL.LI, low line mean, low individual; LL.MI, low line mean, medium individual; LL.HI, low line mean, high individual; and so on). Each line represents a category, and dot represents the average grain yield of all treatments in the given category in the indicated location. For each category, at least 10 lines were included, with three categories having 30 lines (LL.MI, ML.MI, and HL.MI).

