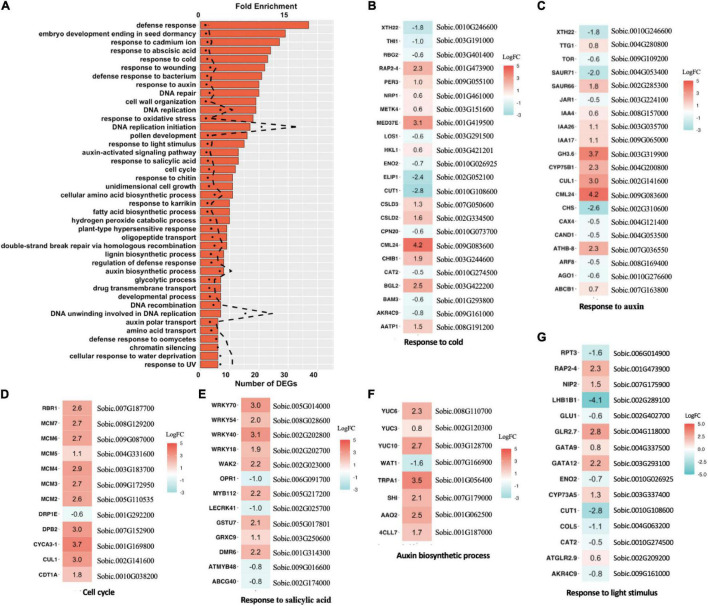
FIGURE 5.
Differentially expressed genes (DEGs) and enriched pathways in epi-F3 lines. (A) Significantly enriched Gene Ontology (GO) pathways for DEGs identified in the high-performance epi-F3 vs. low-performance epi-F3 line comparison. Bar graph represents the number of DEGs, and dotted line represents fold enrichment for the enrichment test. One-sided Fisher’s exact test was performed to compute FDR as implemented in DAVID GO, and p < 0.05 is the cut-off for significance. (B–G) Expression change of individual genes in the significantly enriched pathways for response to cold, response to auxin, cell cycle, response to salicylic acid, auxin biosynthetic process, and response to light stimulus. Sorghum gene ID and corresponding Arabidopsis homolog gene name are listed together. Sorghum bicolor NCBIv3.49.gff3 file was used for annotation. NCBI BLASTP was used to identify the homolog of sorghum genes in Arabidopsis (TAIR10 version 38). Genes upregulated in the high-performance line are in red, and downregulated genes are in blue.

