FIGURE 6.
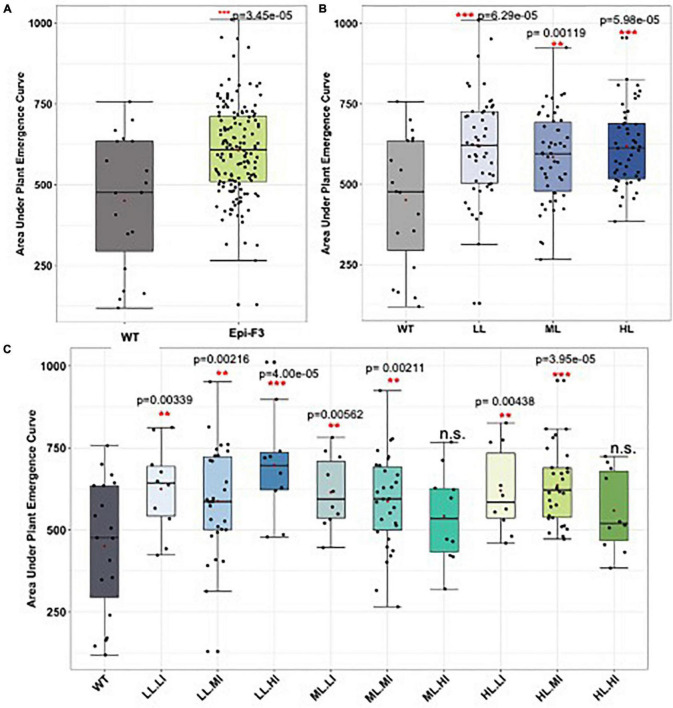
Field cold stress seed germination experiment. A total of 150 epi-F3 and 19 wild-type sorghum Tx430 lines were tested in the field for germination rate under cold stress, with planting at Havelock over two seasons. Planting day soil temperature at 10 cm depth was 11.7°C for experiment 1 and 15.7°C for experiment 2. Standard plantings were carried out at Havelock Farm in mid-May (exp. 1) and mid-June (exp. 2) to assess optimal seed germination rates for each line. Each point represents the average of 2-year data for each line. Plant emergence (number of plants) was recorded on the following days after planting: days 13, 14, 15, 16, 17, 18, 20, 22, 25, 27, 32, 39, and 46. Adjusted emergence data from the early plantings were obtained by dividing early planting emergence by standard planting emergence. Area under the plant emergence curve (AUPEC) and emergence rates were calculated using the adjusted emergence data. Area under the plant emergence curve was calculated as:
Where PEn = plant emergence at time n, and Yn = day at time n. (A) Area under the plant emergence curve of all the 150 epi-F3 lines under cold stress were compared to the WT. (B) Area under the plant emergence curve of the WT compared to the epi-F3 groups, where epi-F3 populations are separated based on the line mean selection strategy used in the yield study. (C) Area under the plant emergence curve of the WT compared to the epi-F3 groups, where epi-F3 populations are separated based on the line mean and individual selection strategy used in the yield study. The least squares mean of each line was computed and a linear mixed-effect model was used for pairwise comparisons between each F3 line and the wild type. **0.001 < p-value < 0.01, and ***p-value < 0.001.

