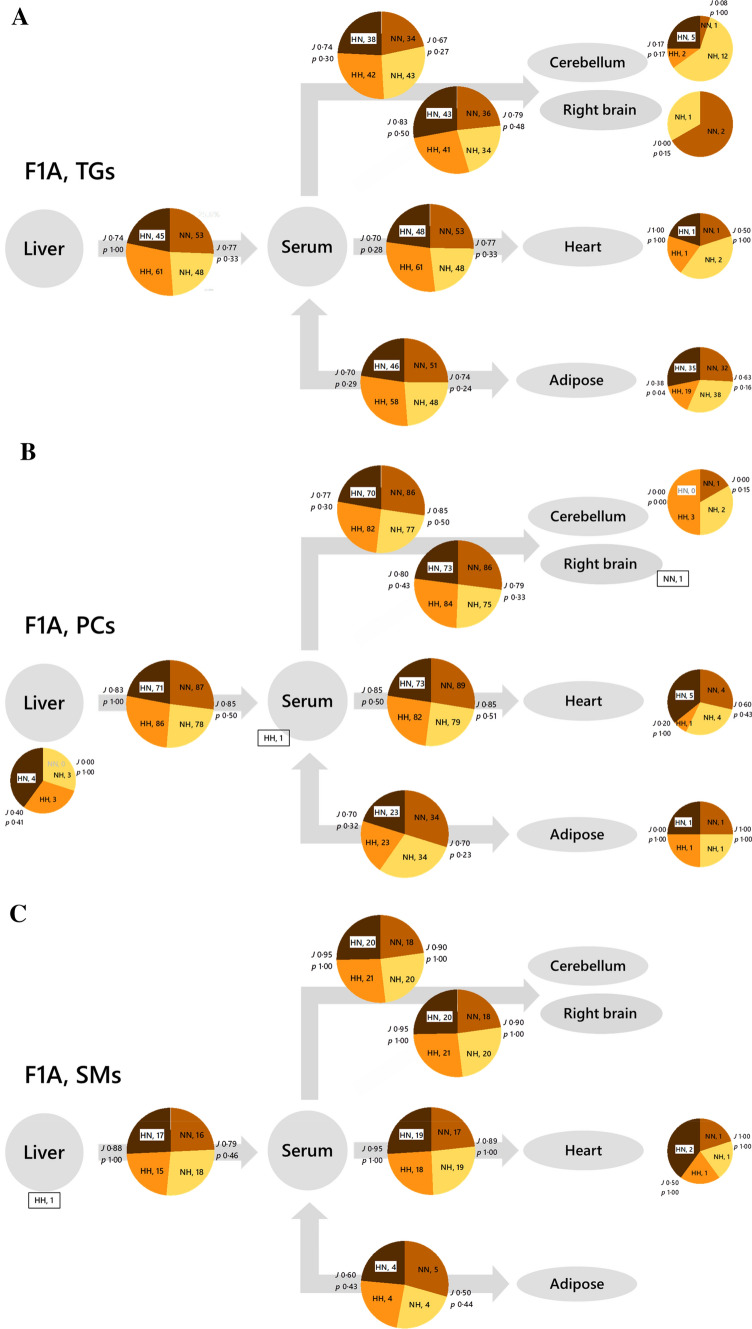
Fig. 4.
Switch analysis of B-type triglyceride (TG), phosphatidylcholine (PC) and sphingomyelin (SM) isoforms for F1 Adults. Panel A, Triglycerides (TGs). Panel B, Phosphatidylcholines (PCs). Panel C, Sphingomyelins (SMs). The Jaccard-Tanimoto coefficients (J) and probability (p) values that describe the similarity between sets of variables. Inset tables show the J and p values for sets of variables with seminal plasma from the same phenotype as the control where the number of variables is similar between the two groups. TGs were detected in positive ionisation mode whereas PCs were detected in negative ionisation mode

