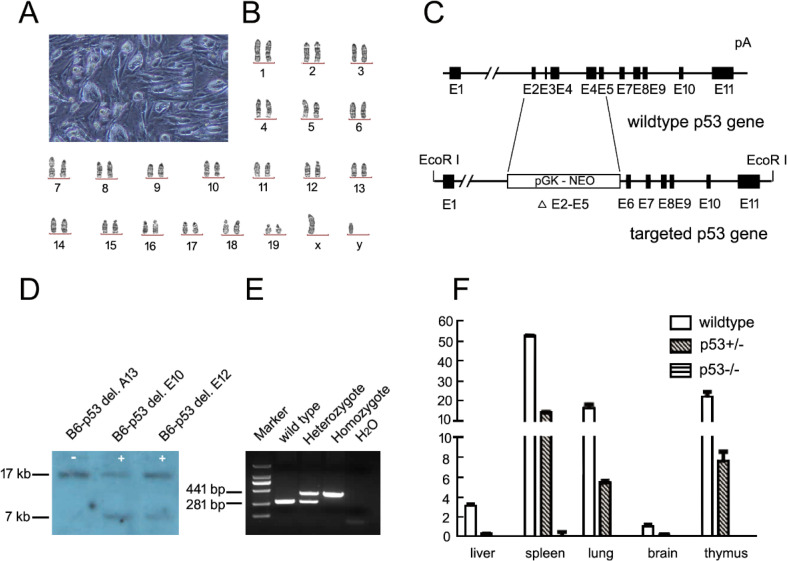
Fig. 1.
Establishment and verification of a p53 gene knockout mouse model. A. Image of p53 gene targeted ES cells on a C57BL/6J background. B. Karyotype of targeted ES cells. C. Schematic representation of p53 gene knockout construction; exons 2–5 were replaced by a Neo cassette. D. Southern blotting analyses of mouse tail DNA. Genomic DNA was extracted from ES cells and used for Southern blotting analysis. After digestion with EcoRI (for the 5′ probe), the probe hybridized to a 17 kb fragment from the wild-type allele (+) and a 7 kb fragment from the p53 gene knockout allele (−). E. PCR genotyping analysis of wild type, heterozygous, and homozygous p53 gene knockout mice. The expected sizes of PCR products are 281 bp for the wild-type allele and 561 bp for the knockout allele. F. Relative real-time PCR analysis of the p53 gene mRNA in the liver, spleen, lung, brain, and thymus of wild-type, heterozygous, and homozygous p53 gene knockout mice. Values are shown as the mean ± SD for three independent experiments and were normalized to the corresponding GAPDH levels.

