
Extended Figure 6. Live imaging of neural crest cells.
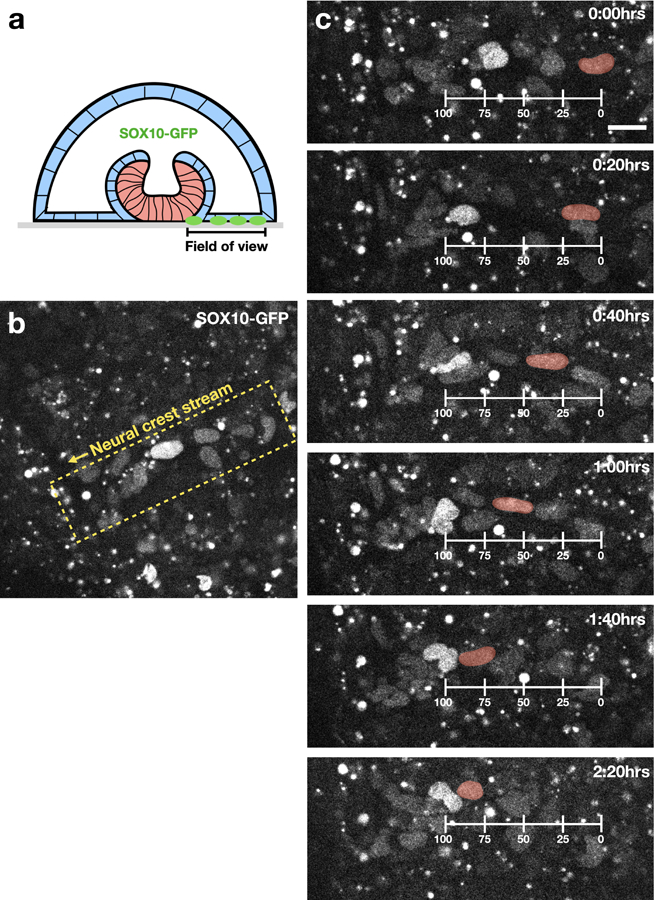
Time-lapse images showing motion of neural crest cells (SOX10-GFP). (a) Scheme indicating region in which live imaging was performed. (b) Low magnification image showing neural crest cells are organized in a stream. (c) Neural crest cell motion along the stream. A single cell is tracked and artificially colored in red. Scale bar 25μm.