
Extended Figure 8. Single cell expression of key cell type markers.
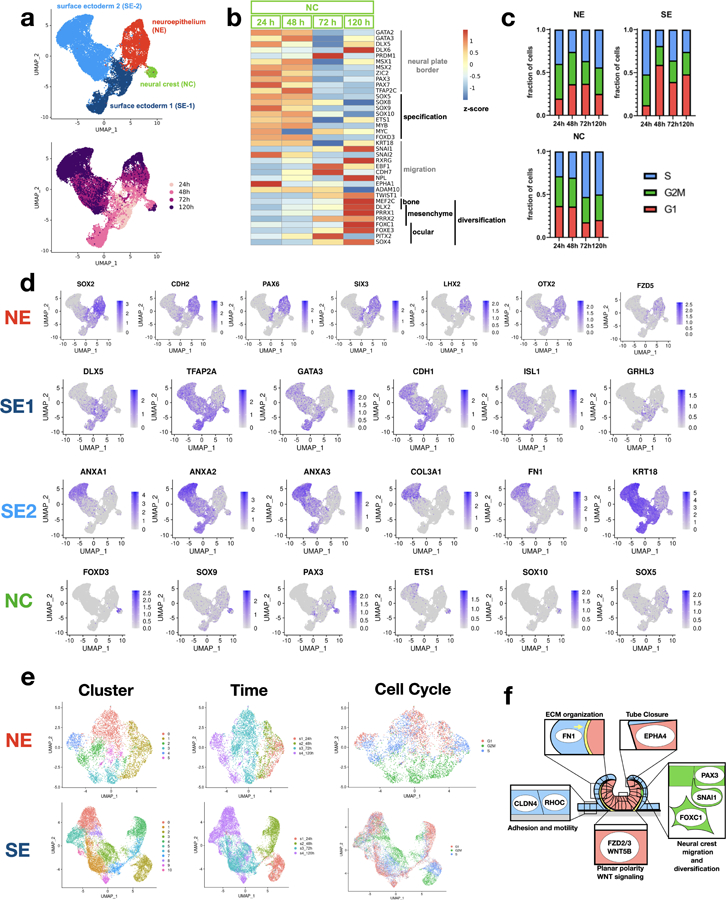
(a) UMAP plots of single cell gene expression color coded by cluster identity (top) and experimental time point (bottom). Four main cell clusters are observed. (b) Temporal evolution of gene expression in the neural crest population indicate a transition from neural plate border/neural crest specification to migration and divarication. (c) Inferred cell-cycle populations for three clusters: neural ectoderm (NE), surface ectoderm (SE), and neural crest (NC). SE exhibits increase in G1 over time, and NC exhibits a decrease in G1. (d) Expression of key cell type markers from the four main clusters. (e) Sub-clustering of NE and SE. Neural cells sub-cluster mainly by experimental time and cell-cycle phase, which correspond to UMAP 1 and 2. In contrast, surface ectoderm cells sub-clusters do not cluster by cell-cycle or experimental time, suggesting additional differences in cell identity. (f) Scheme showing cellular process in each cluster. Titles are enriched GO pathways, and example genes appearing within each pathway.