
Figure 4. Neural plate size determines neural tube shape.
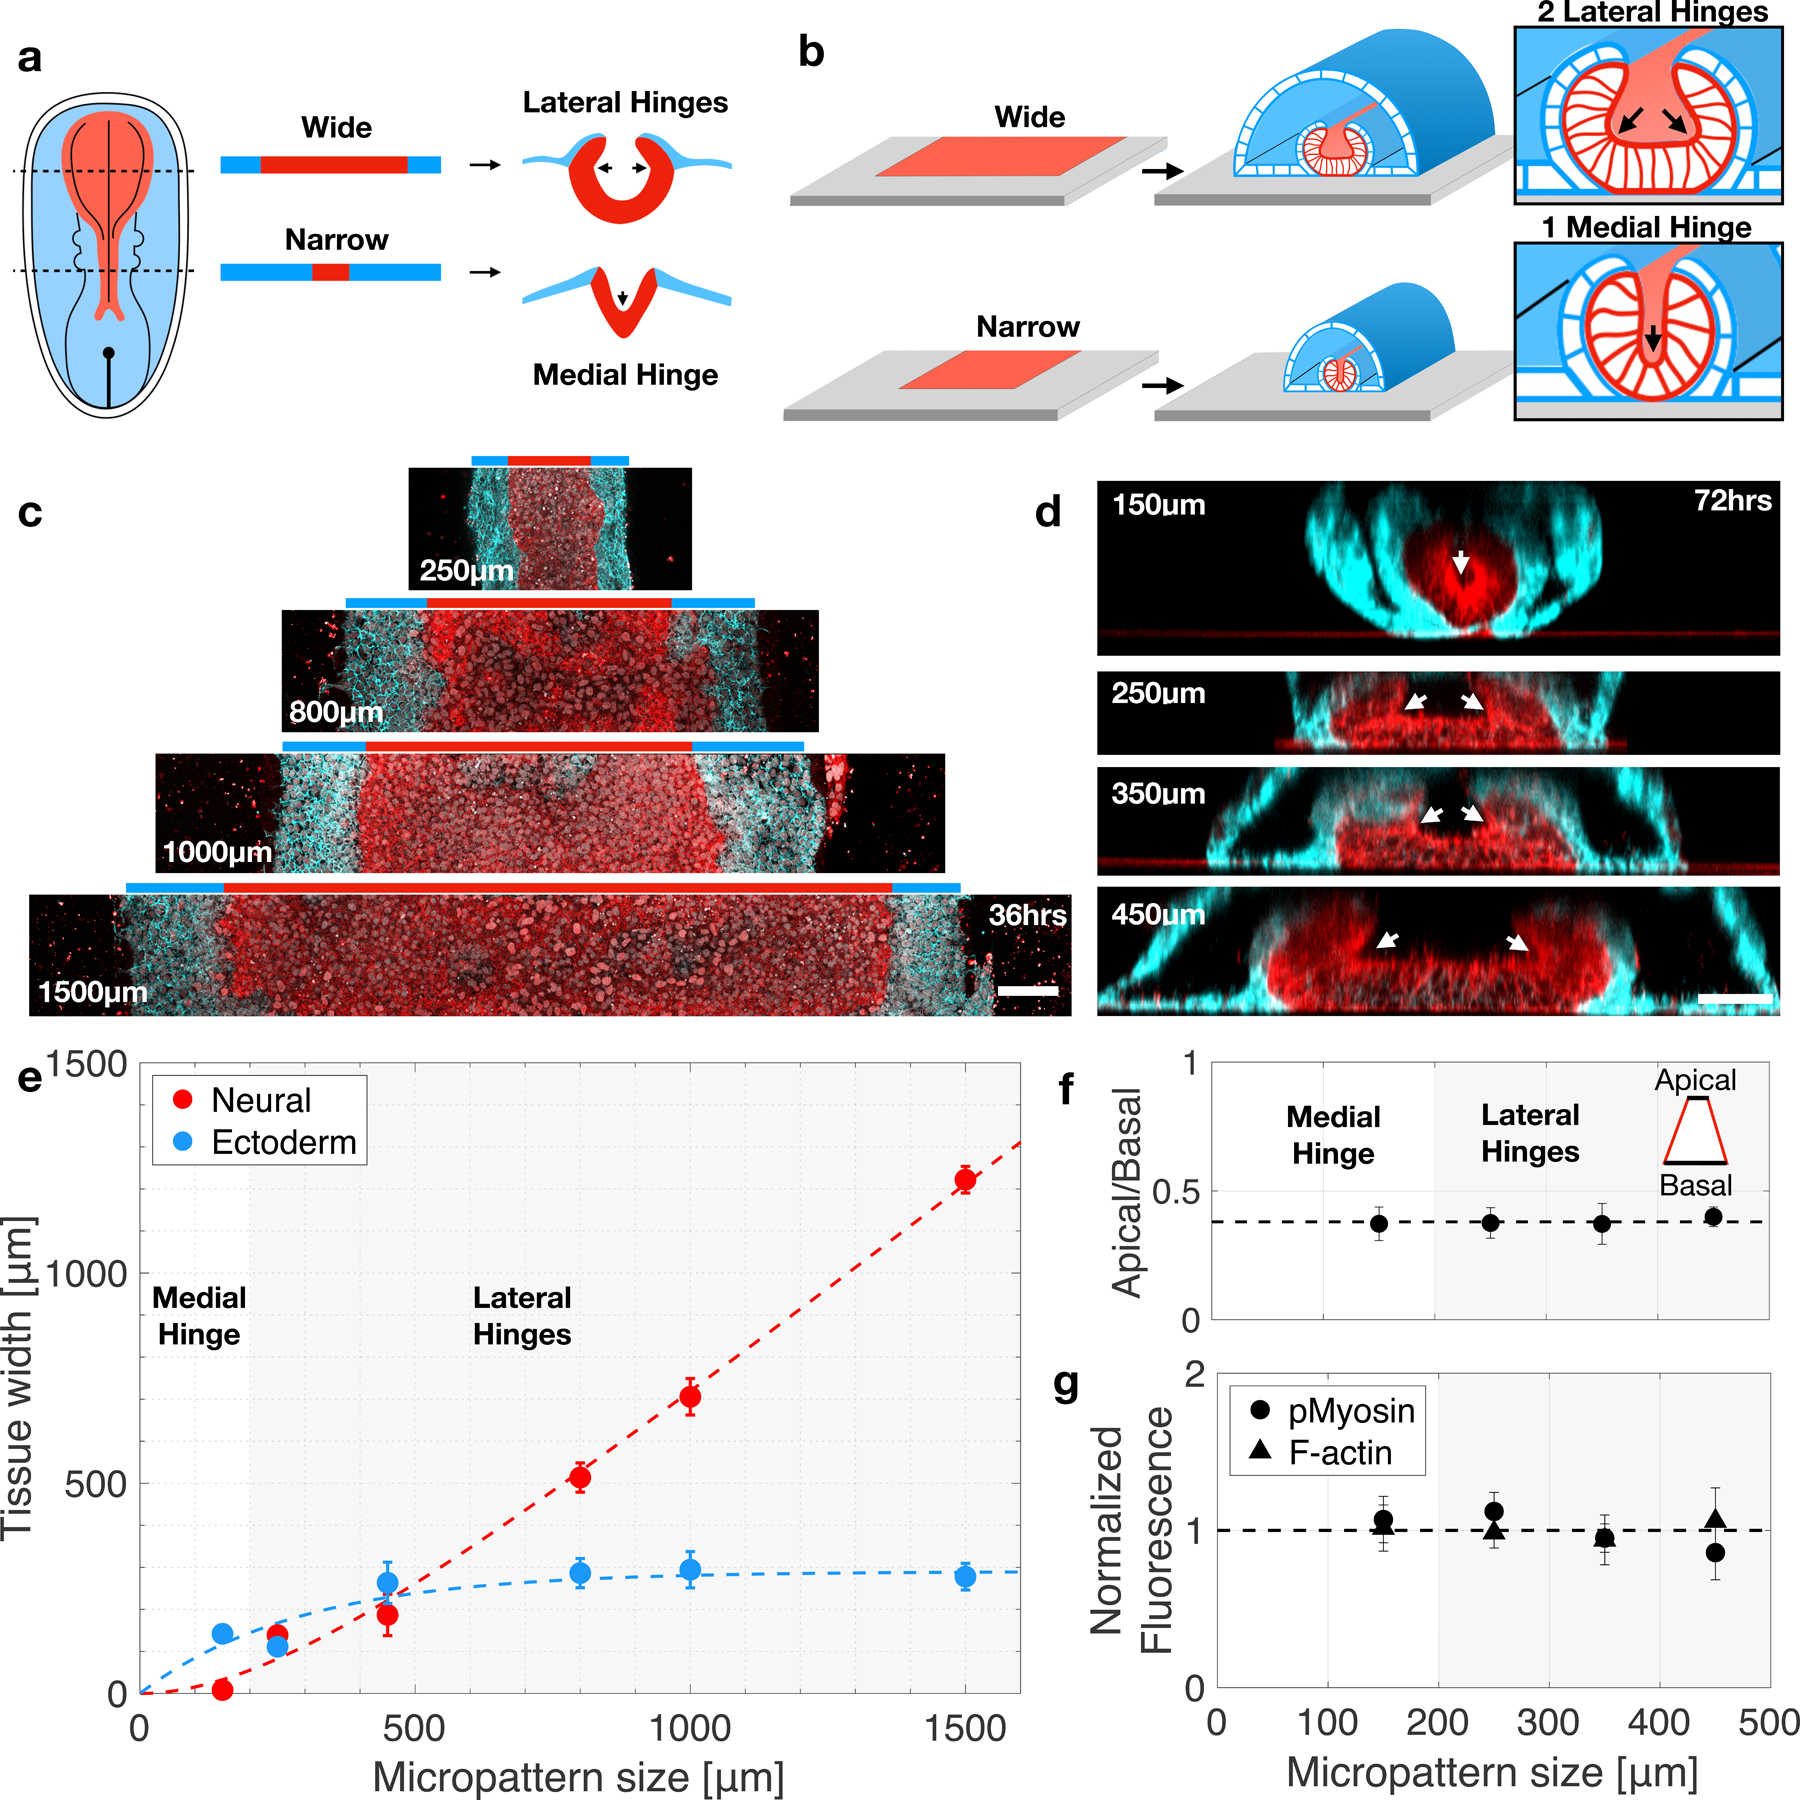
(a) Schematic of neural plate size and neural tube shape along the anterior posterior axis. (b) Experimental design - micropatterns are created at increasing widths to study the effect of tissue size on fold morphology. (c) Horizonal sections show neural (NCAD, red) and ectoderm (ECAD, cyan) pattern formation at varying micropattern widths. (d) Vertical sections reveal neural fold morphology changes as micropattern width increases. At 150µm a single medial hinge is observed, whereas larger micropatterns result in two lateral hinges. Total N=58 samples. (e) Neural and ectoderm tissue width as a function of micropattern size. White (grey) area correspond to regions in which a single (double) hinge are observed. N=10. (f) Ratio of apical to basal neural area as a function of micropattern size. N=3. (g) Normalized fluorescence intensity for F-actin and phosphorylated myosin light chain 2 as a function of micropattern size. N=12. Scale bars 100μm (c) and 50μm (d). Data are presented as mean values +/- SD (e-g).