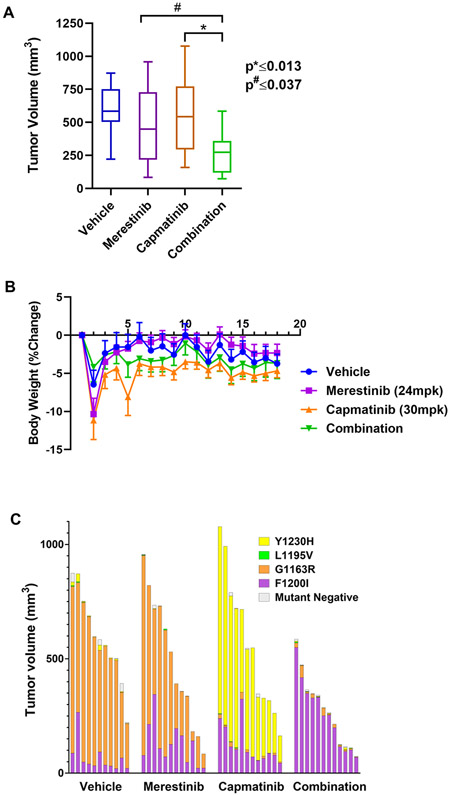
Figure 5.
The merestinib/capmatinib combination shows efficacy and tolerability in vivo. A, A box plot of volume of tumors harvested from mice on day 18 of treatment. *, # denote significance. B, Plot of body weight percent change of treated mice as a function of treatment time. C, The individual contribution of each TPR-MET mutant was determined by ddPCR at the end of the study and expressed as percent tumor volume. Each bar represents an individual treatment subject.

