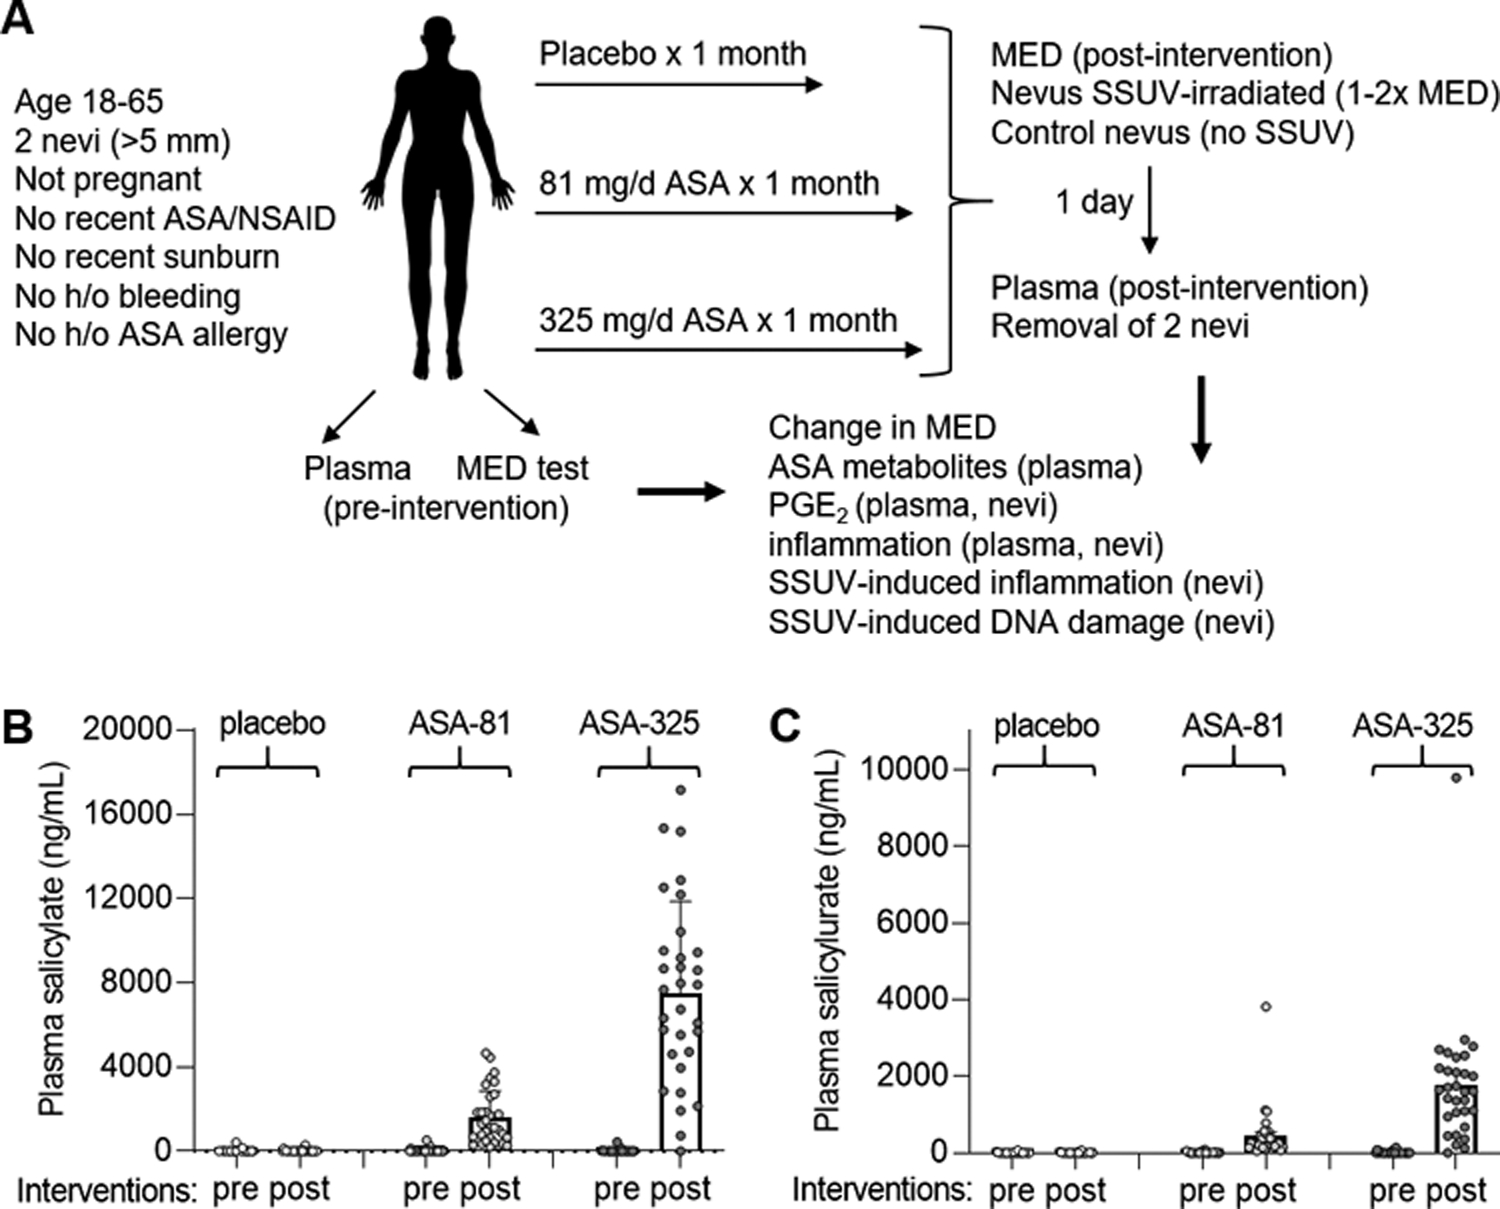
Fig. 1.

Trial design and measurement of ASA metabolites. A, Summary of randomized controlled trial, procedures and analyses performed. B, Mean plasma salicylate levels in pre- and post-trial samples from subjects in the placebo and two ASA cohorts. Error bars indicate SEM. C, Mean plasma salicylurate levels in pre- and post-trial samples. Error bars indicate SEM.
