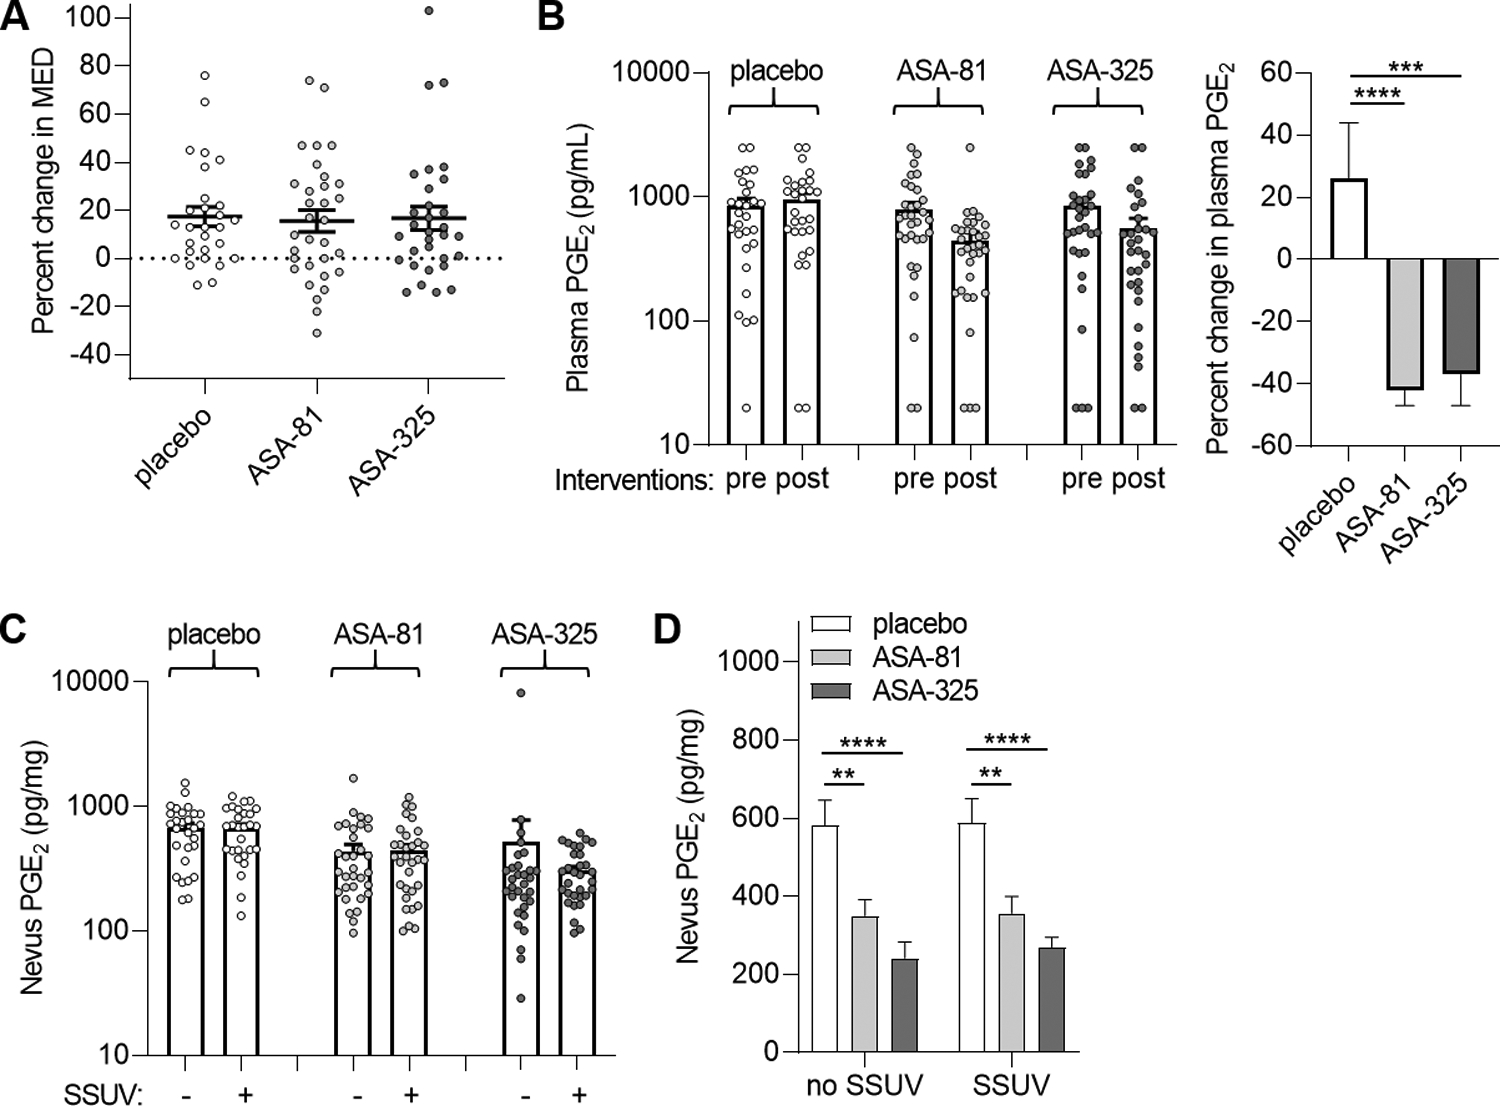
Fig. 3.

MED and modulation of PGE2 in plasma and nevi. A, Mean percent change in MED (post-intervention compared to pre-intervention measurements) in the cohorts receiving placebo (n=28), 81 mg daily ASA (ASA-81, n=32), and 325 mg daily ASA (ASA-325, n=31). Error bars indicate SEM. Paired analyses did not reveal significant changes in MED in any cohort or between either ASA cohort and placebo (P=0.7). B, Mean PGE2 levels in plasma obtained before (pre) and after (post) intervention (left panel). Percent changes in plasma PGE2 for each group (right panel). Error bars represent SEM. ***P=0.001, ****P<0.0001, paired tests. C, Mean PGE2 levels in unirradiated and solar-simulated UV (SSUV) -treated nevi. Error bars represent SEM. Paired analyses did not reveal significant differences in PGE2 between unirradiated and SSUV-treated nevi within the placebo (P=0.93), ASA-81 (P=0.85) or ASA-325 (P=0.48) cohorts. D, Comparison of nevus PGE2 levels among the groups for unirradiated (no SSUV) and SSUV-treated nevi. **P<0.01, ****P<0.0001, paired t tests. Values were lower in the ASA-325 compared to the ASA-81 cohorts which approached statistical significance for unirradiated (P=0.08) and SSUV-treated nevi (P=0.07).
