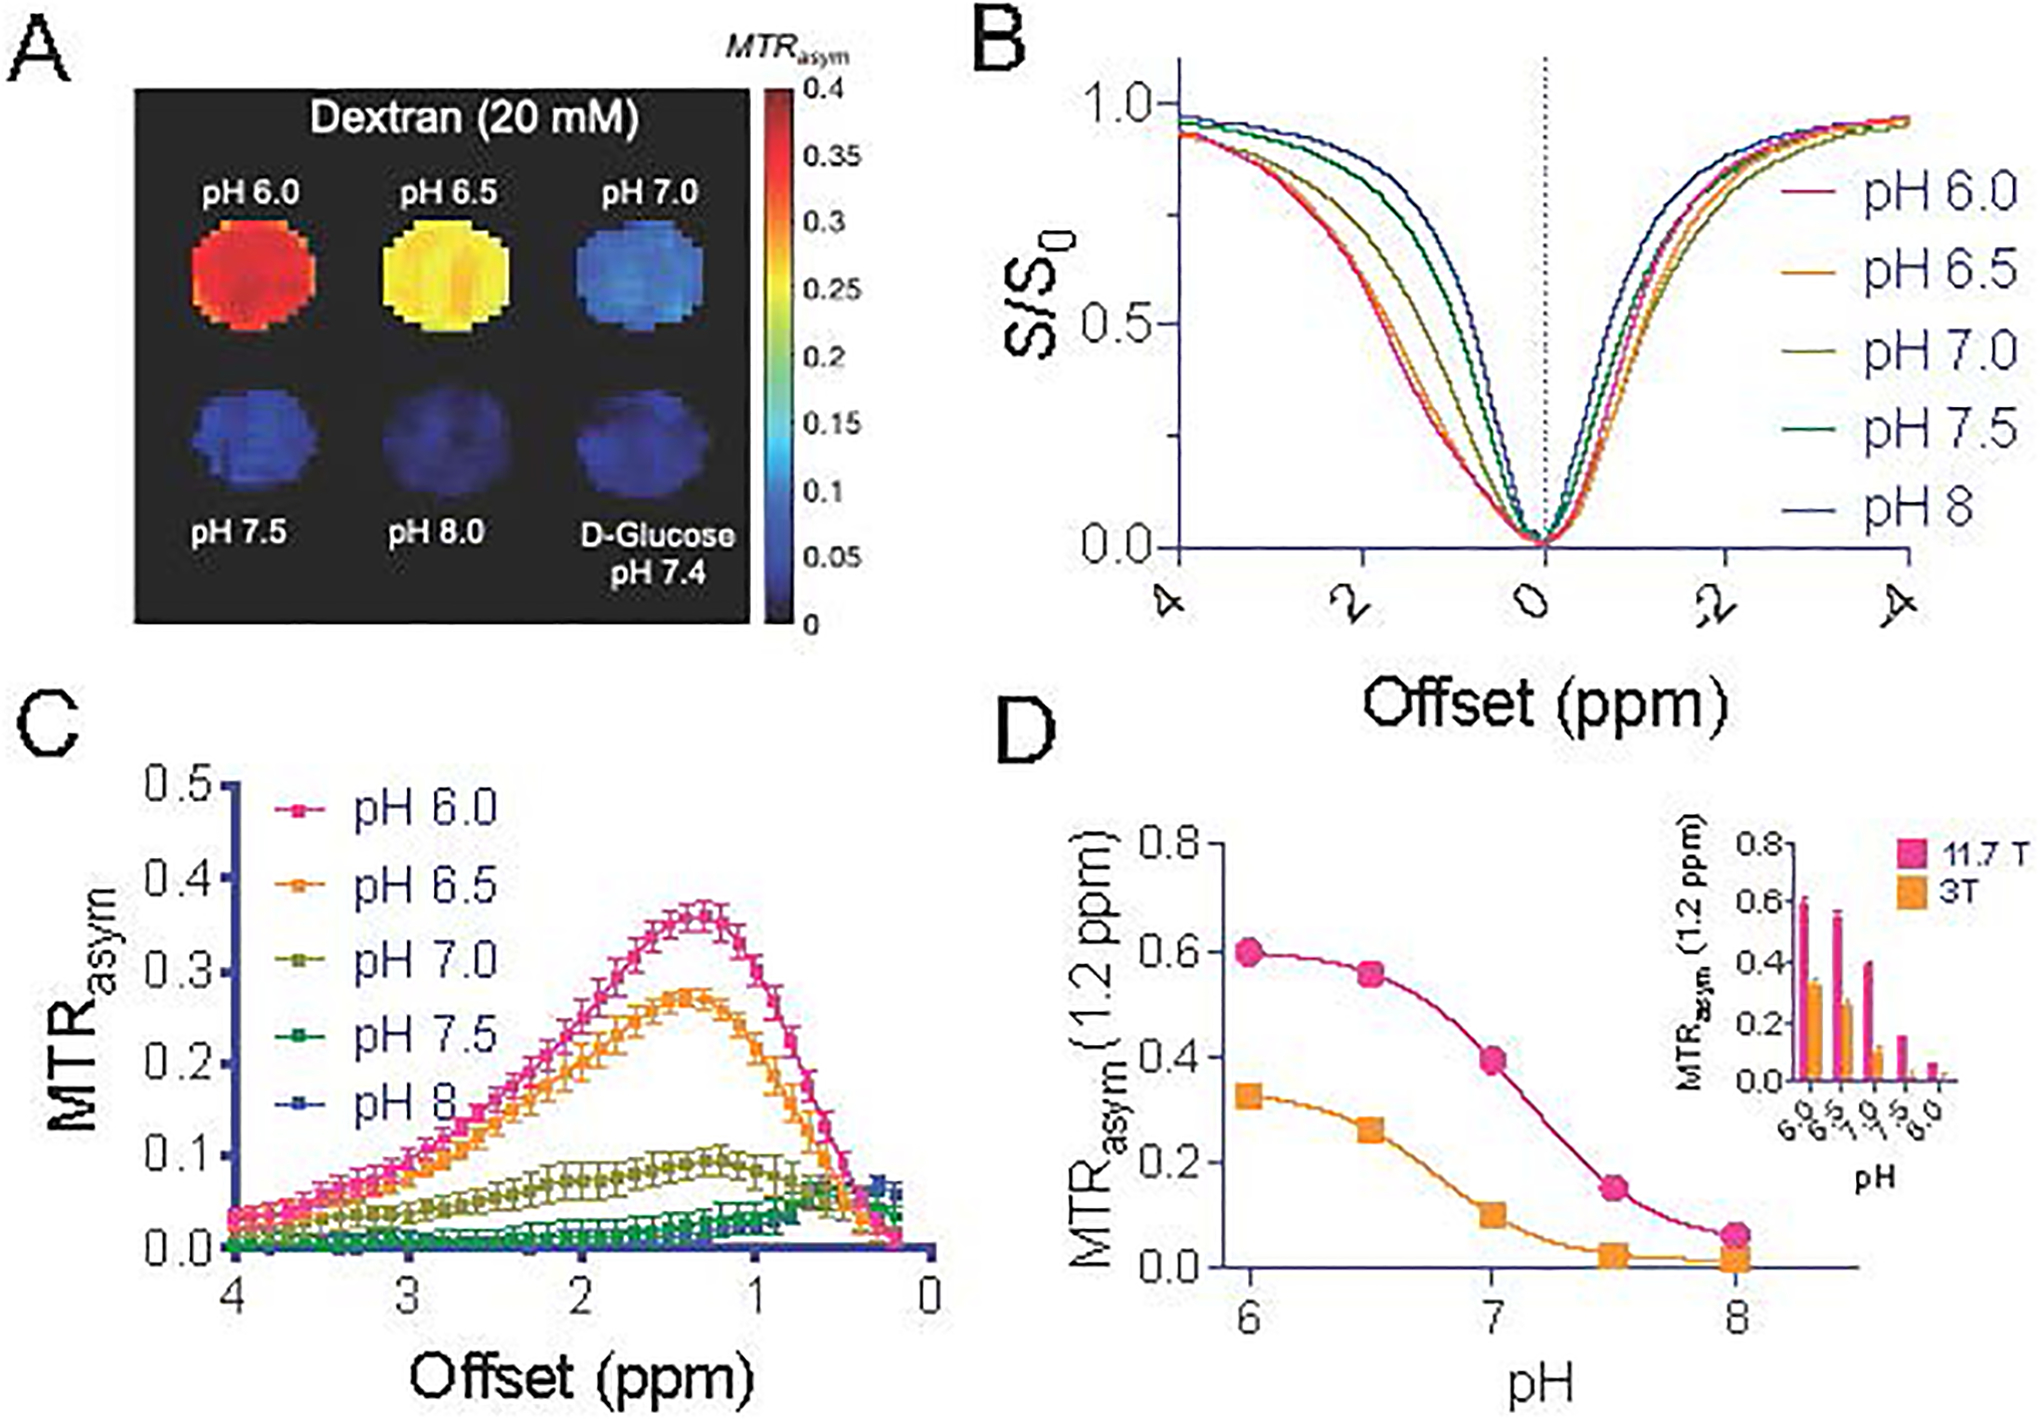
Figure 3. DexCEST (B1=1.8 μT/3 sec) contrast at 3T.

A) MTRasym parametric maps of Dex1 (20 mM) at a function of pH (37 °C). Note that a D-glucose sample (20 mg/mL, pH 7.4) was included as control. B) Z-spectra and C) MTRasym of 10 mM Dex1 at pH ranging from 6.0 to 8.0. D) pH dependency of DexCEST contrast at 3T as compared to that at 11.7T.
