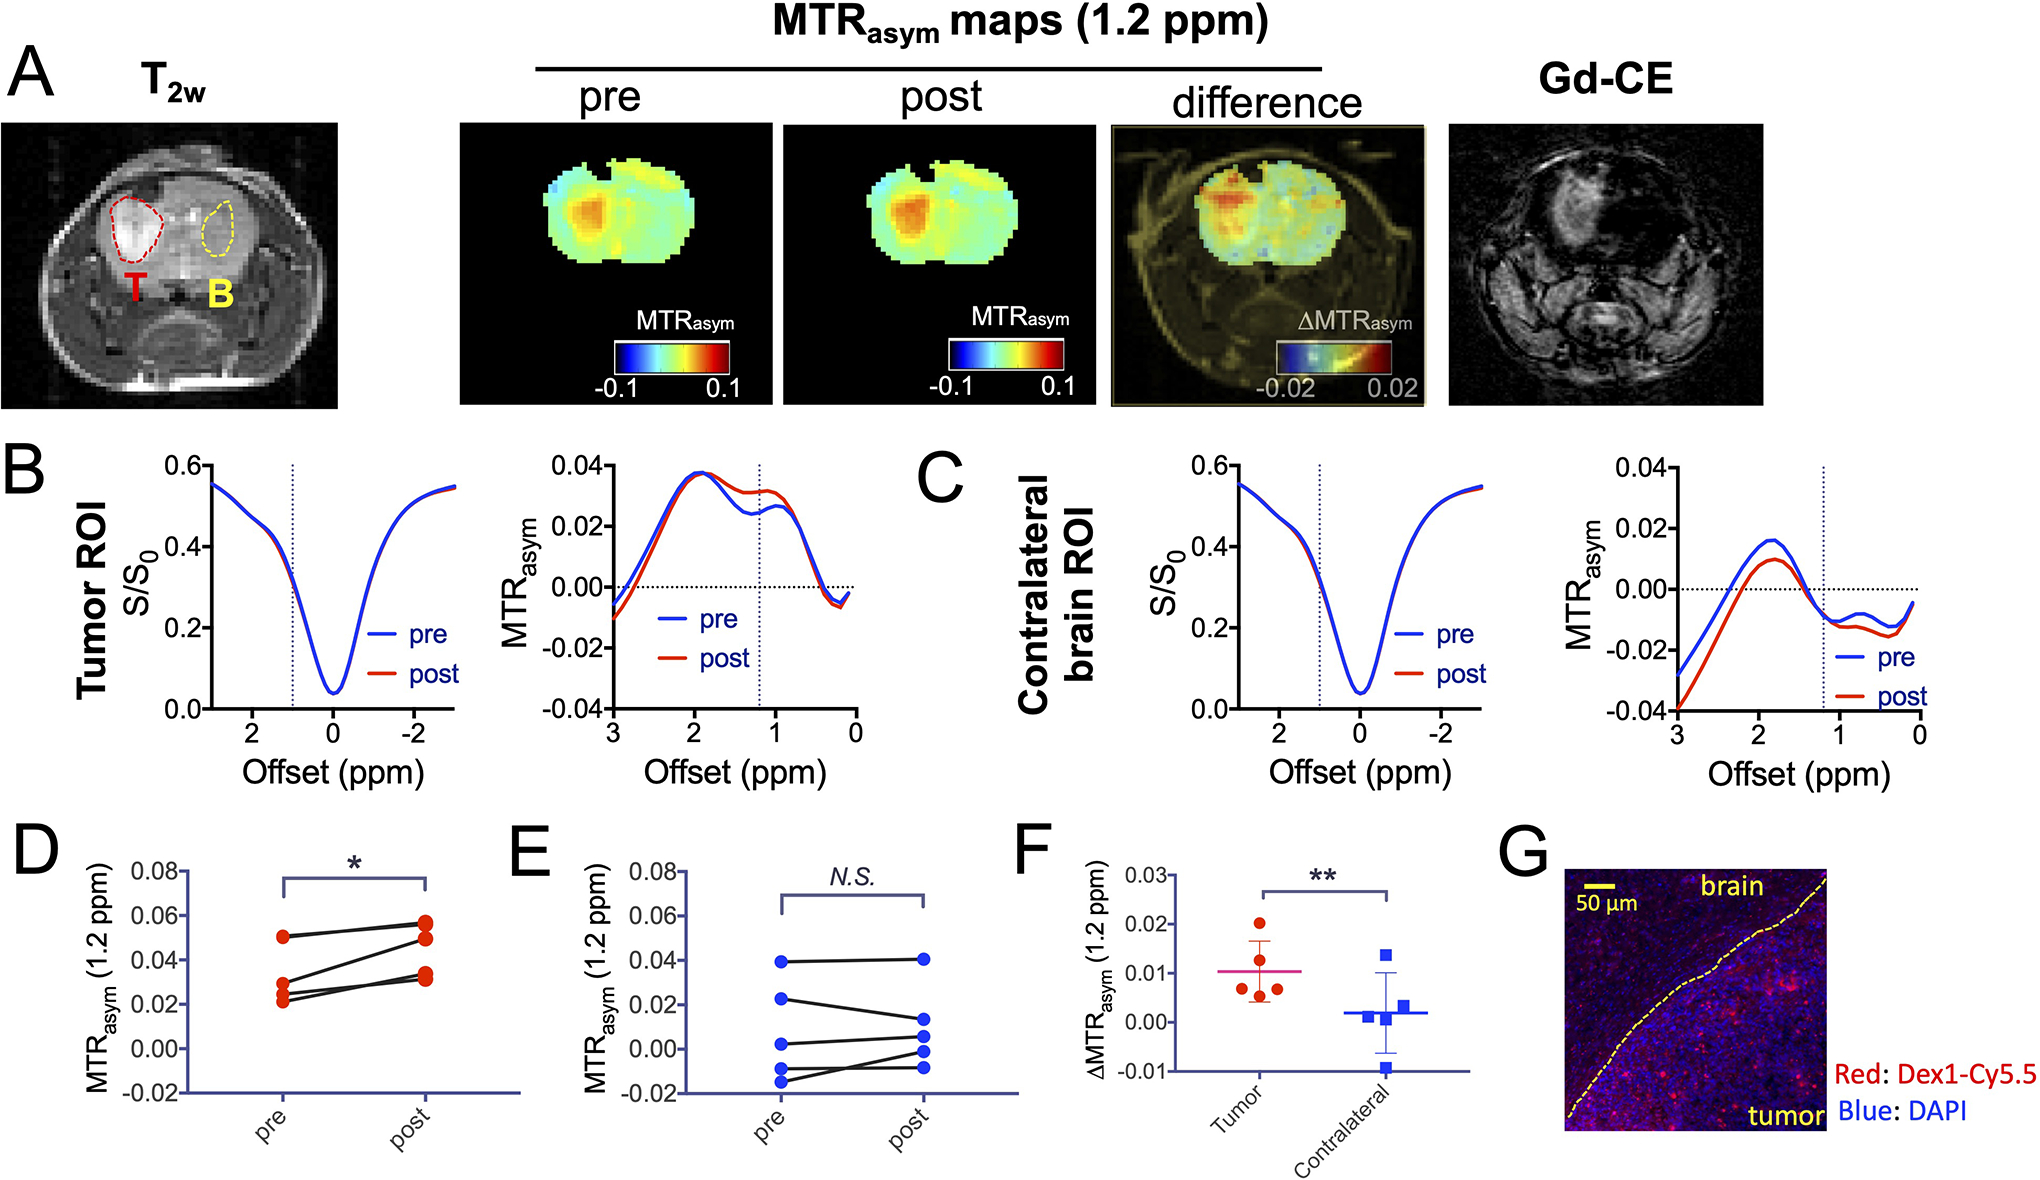
Figure 4. Dex1-enhanced CEST MRI in the GL261 brain tumor model.

A) From left to right: T2w, CEST images, and Gd-enhanced image of a representative mouse. B-C) Mean ROI Z-spectra and MTRasym plots before and after dextran1 injection in the tumor (B) and contralateral brain (C). D-E) Comparison of the pre- and post-injection CEST contrast in the tumor (D) and brain (E) of 5 mice. F) Comparison of dextran1-induced contrast enhancement in the tumor and brain in 5 mice. G) Immunofluorescence image showing the high uptake of Dex1 in the tumor, in which blue is nuclei (stained with DAPI) and red is dextran (labeled with Cy5.5). Right lower area: tumor; left upper area: normal brain. *: P<0.05, **: P<0.01, N.S.= not significant (Student’s t test, two tailed and paired, n=5).
