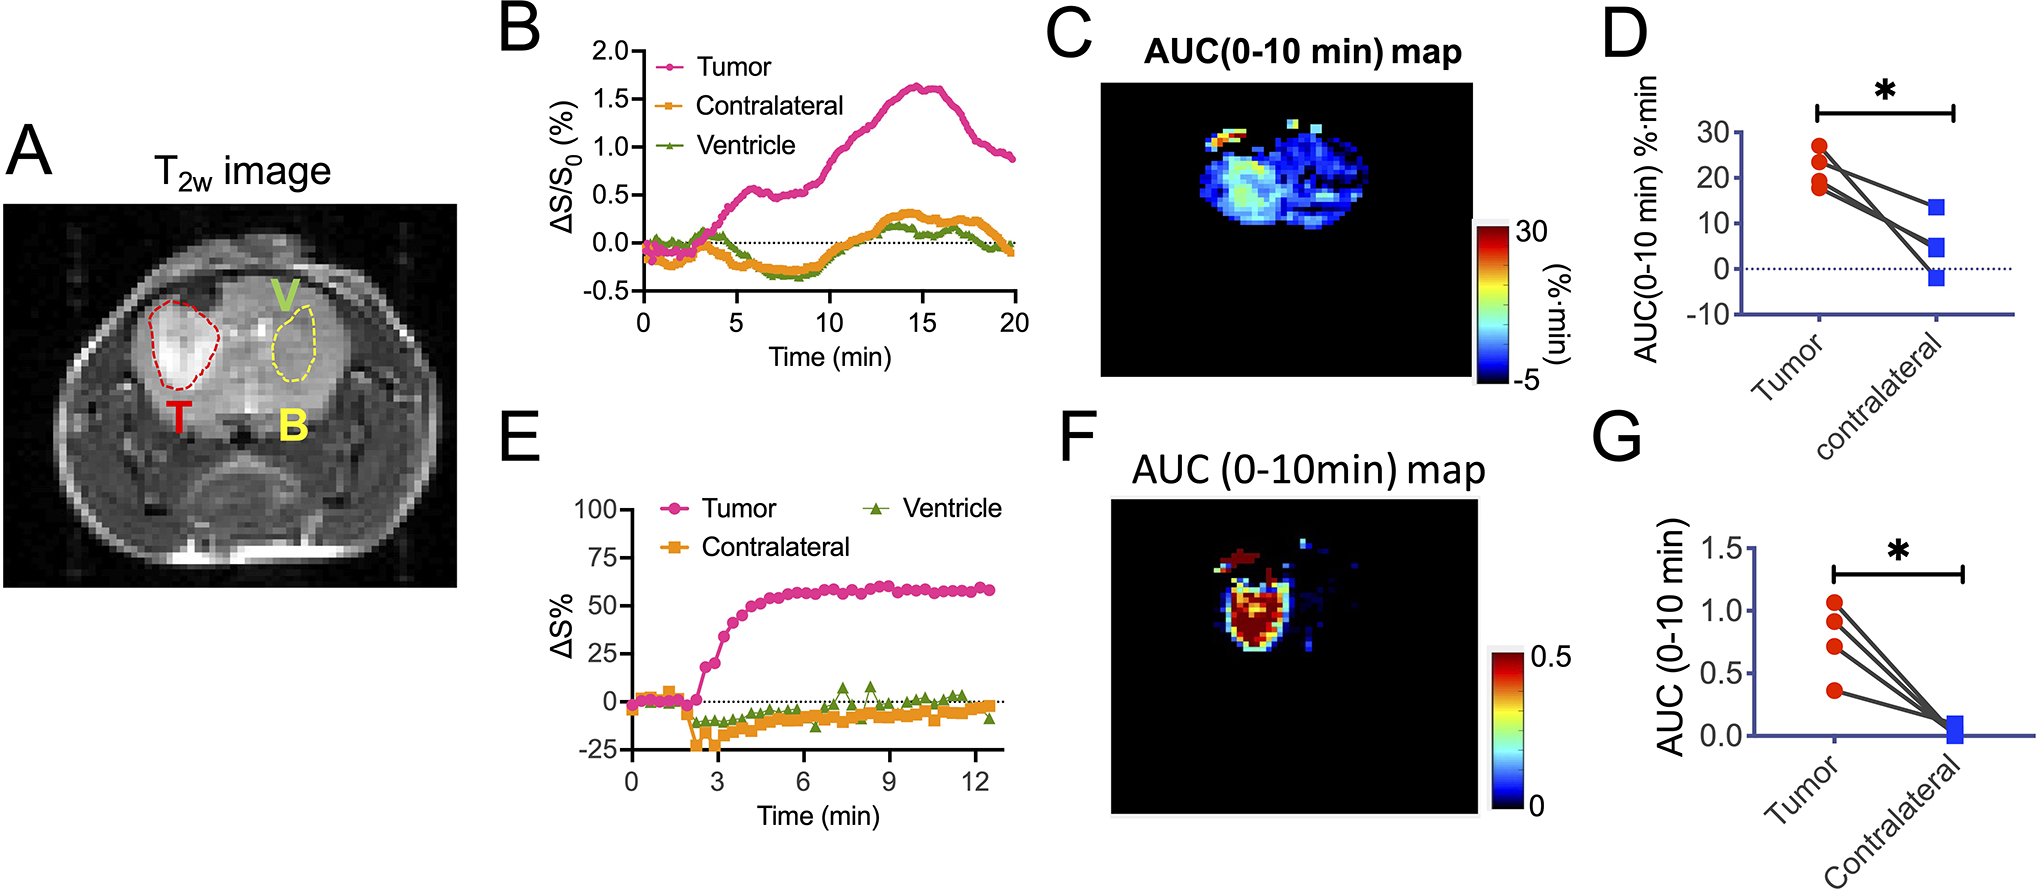
Figure 5. DDE CEST MRI in the GL261 brain tumor model.

A) T2w image showing the three ROIs for tumor (T), brain (B) and ventricle (V). B-D) Dynamic changes of the mean CEST contrast, as quantified by ΔS1.2ppm/S0 (t)%= [S1.2ppm/S0 (t=0)- S1.2ppm/S0 (t)]x100% (B). C) AUC map between 0 to 10 min after the injection of Dex1. D) Comparison of the mean AUC values in the tumor and brain. E-F) Dynamic Gd concentration change after the injection of 0.1 mmol/kg ProHance (~ 0.05 mL of 0.5 M solution). F) DCE AUC (0–10 min) map. G) Comparison of the mean AUC (0–10 min) in the tumor and brain. *: P<0.05 (Student’s t test, two tailed and paired, n=4).
