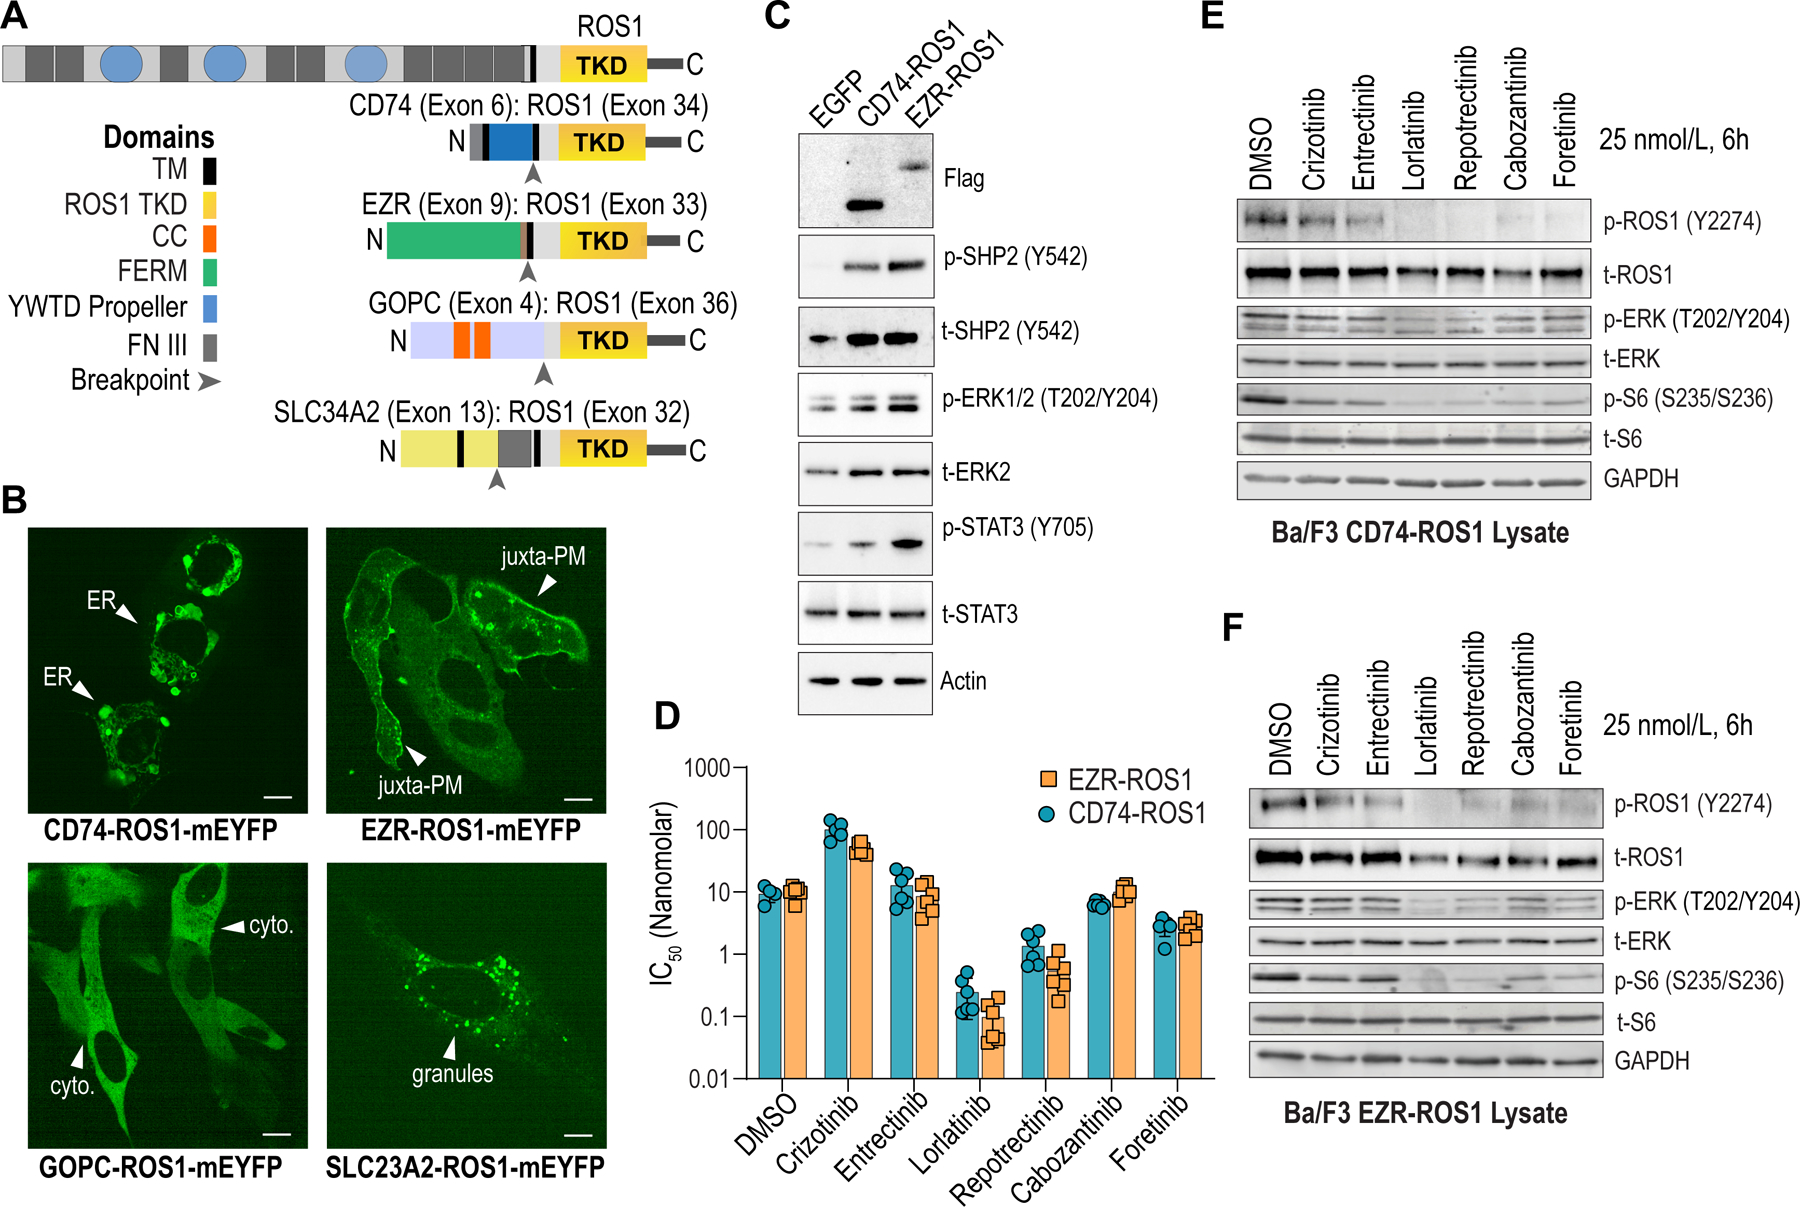
Figure 1. Characterization of subcellular localization, activity, and inhibitor sensitivity of ROS1 fusions.

A, Domain organization of ROS1 fusions. TKD - ROS1 tyrosine kinase domain; TM – Transmembrane domain; FERM – Protein 4.1 Ezrin Radixin, Moesin domain; CC – coiled-coiled domain; YWTD Propeller - β Propeller domain; FN III – fibronectin type III repeat. B, Live cell imaging (spinning disk confocal microscopy) of monomeric yellow fluorescent protein (mYFP)-tagged ROS1 fusion proteins. White arrowheads indicate endoplasmic reticulum (ER), juxta-plasma membrane (juxta-PM), cytoplasm (cyto), and membraneless cytoplasmic granules (granules). C, Immunoblot analysis of the phosphorylated and total proteins shown in transfected HEK293T cell lysates. Anti-Flag antibody was used to detect Flag-tagged ROS1 fusion. D, IC50 values indicate relative potency (nanomolar) of the indicated ROS1i for Ba/F3 CD74-ROS1 or EZR-ROS1; six replicate data points are shown. E & F, Immunoblot analysis of the phosphorylated and total proteins shown DMSO or ROS1i-treated (25 nmol/L, 6 hours) in cell lysates generated from Ba/F3 CD74-ROS1 and EZR-ROS1, respectively. Representative immunoblots from two independent experiments are shown.
