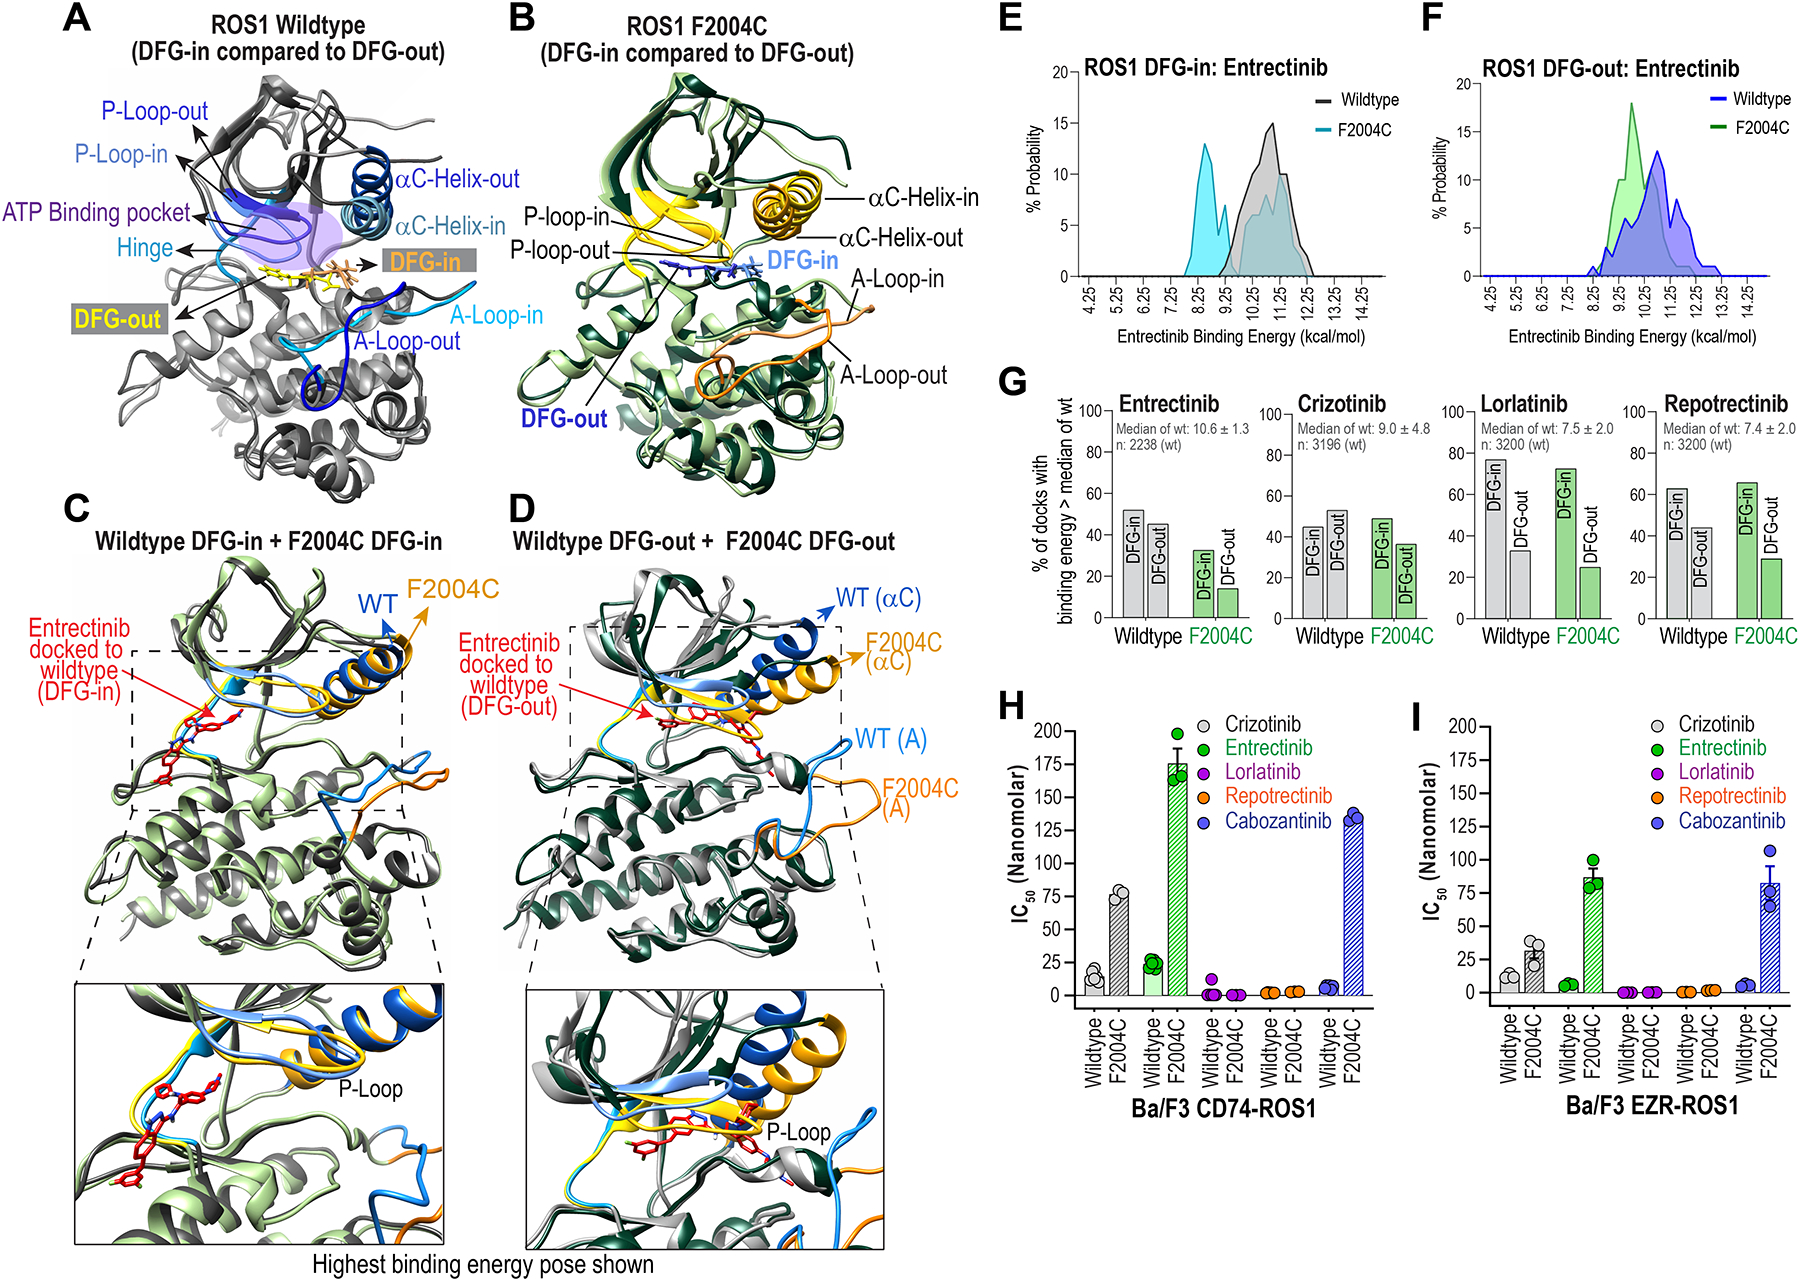
Figure 3. Structural assessment of ROS1F2004C with molecular dynamic simulation and inhibitor docking studies reveal entrectinib binds both DFG-in and DFG-out ROS1 kinase domain.

A & B, Superimposed wildtype ROS1 (A) and ROS1F2004C mutant crystal structure models in DFG-in and DFG-out conformations are shown to highlight distinctions in structural features: Activation loop (A-Loop), αC Helix, P-loop, ATP-binding pocket, and the positioning of the aspartic acid (D), phenyalanine (F) and glycine (G), i.e., DFG motif in the two conformations. C & D, Superimposed crystal structures show conformational differences between wildtype ROS1 and ROS1F2004C in their DFG-in (C) and DFG-out (D) states. E & F, Histograms show binned probability distribution of binding energy (kcal/mol) for ROS1WT and ROS1F2004C in the DFG-in (E) and DFG-out (F) kinase conformation. Binding energies were determined with Yasara; in this case the higher binding energies reflect more favorable binding. G, Percentage of docks whose binding energy was greater than the median binding energy of indicated inhibitor docking to ROS1WT DFG-in and ROS1WT DFG-out is plotted. The median binding energy ± standard deviation and the total number of docks for the ROS1WT DFG-in & ROS1WT DFG-out conformations is indicated inset within graph and panel below graph. H & I, IC50s of crizotinib, entrectinib, lorlatinib, repotrectinib and cabozantinib as derived from dose-response cell viability assay with Ba/F3 CD74-ROS1 (H) and Ba/F3 EZR-ROS1 (I), wildtype or F2004C mutant cells.
