
Figure 4. Activity of first and next-generation ROS1 inhibitors against spectrum of ROS1 intracellular mutations in CD74-ROS1 and EZR-ROS1.
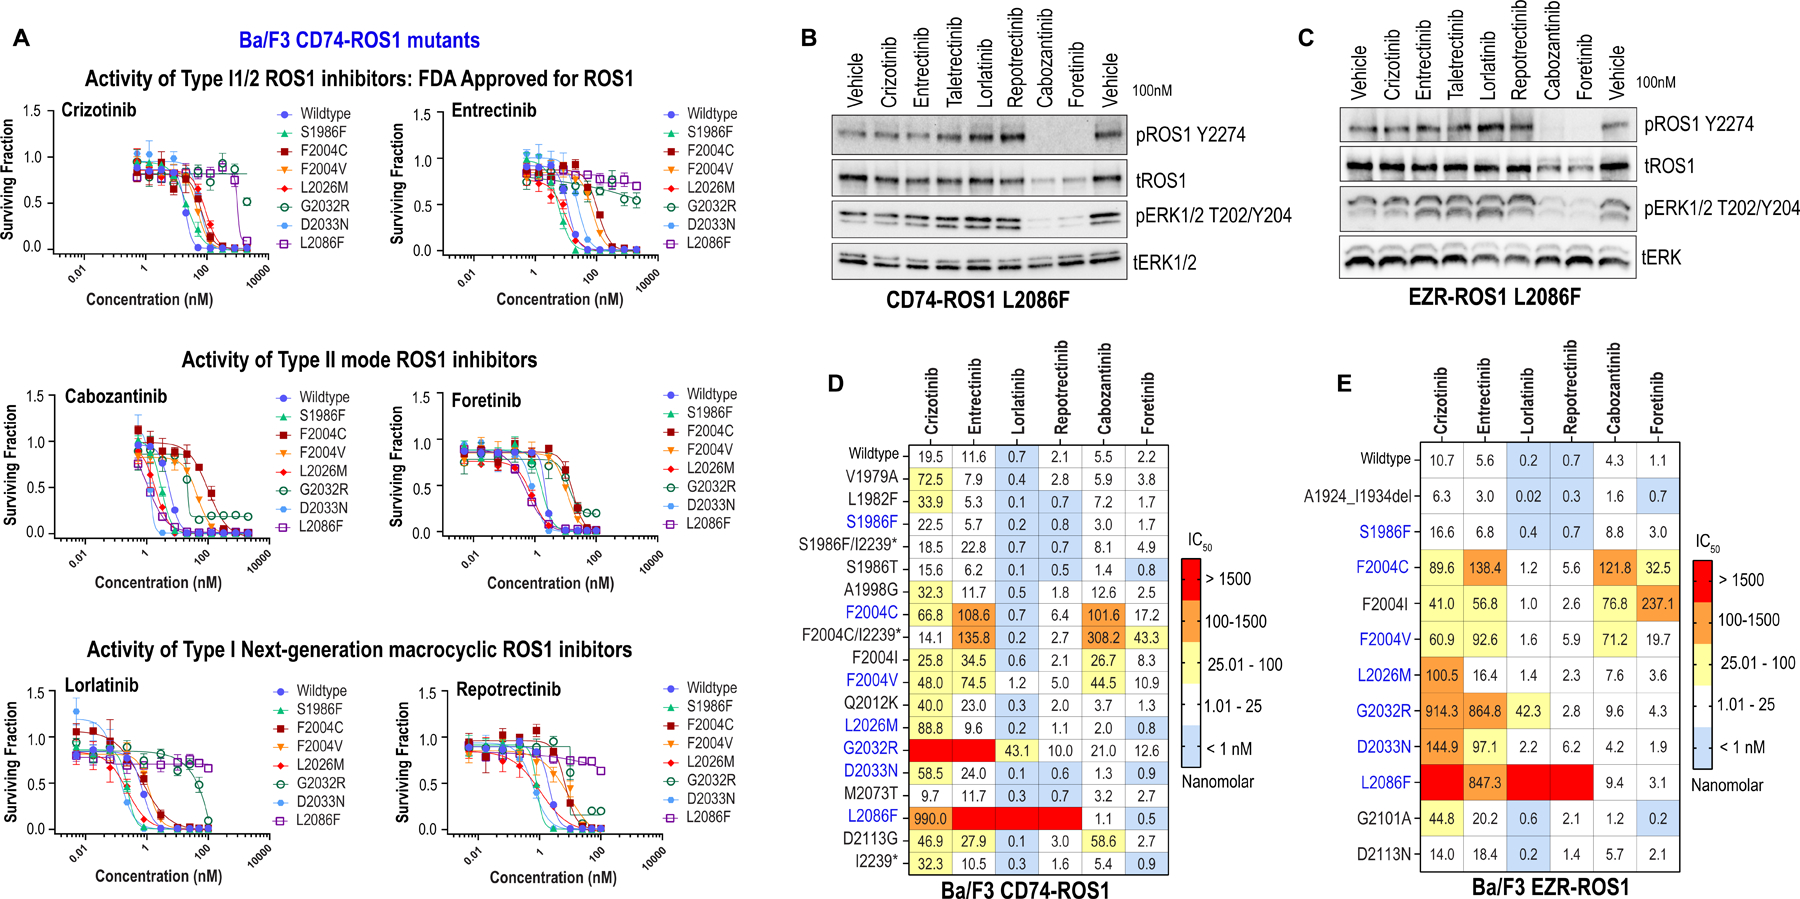
A, Dose response cell viability assays of clinically relevant (S1986F, F2004C, F2004V, L2026M, G2032R, D2033N and L2086F compared to wildtype) ROS1 kinase domain mutations in Ba/F3 CD74-ROS1 cells. Average ± SEM shown for all data. B & C, Immunoblotting of Ba/F3 CD74-ROS1L2086F and EZR-ROS1L2086F cells treated for 6 h with 100 nM of indicated inhibitors. Phosphorylated and total ROS1 and ERK1/2 are shown. D & E, Heat map of IC50 values (nanomolar) of crizotinib, entrectinib, lorlatinib, repotrectinib, cabozantinib and foretinib for Ba/F3 CD74-ROS1 (D) and EZR-ROS1 (E) mutant cell lines. IC50 are average of two to four replicates for each mutant and each inhibitor. Color scale for heatmap in indicated in the figure.