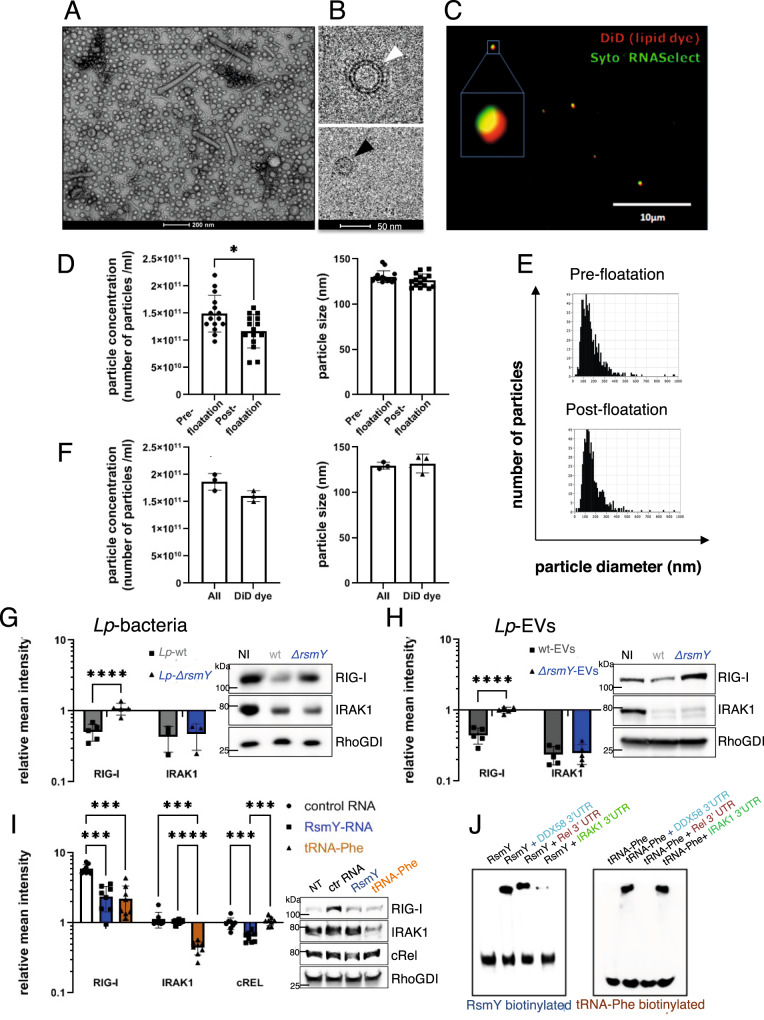
Fig. 1. Lp-EVs are a population of single and double membrane vesicles that contain small RNAs modulating RIG-I and IRAK protein levels.
A Negative staining transmission electron microscopy of Lp-EVs (n = 1). B Cryogenic transmission electron microscopy (n = 1), unilamellar EVs (black arrow), two lipid bilayer EVs (white arrow). C Fluorescence microscopy, DiD (red) and Syto-RNAselect (green) labelled Lp-EVs, (n = 5). D Absolute particle concentration (left) and median size (right) of purified Lp-EVs determined by ZetaView. Each dot represents a single measurement performed in triplicates and the (mean) SD of n = 5. Statistical analysis performed using unpaired t-test (two-tailed, p < 0.05 significant). Red Square, representative size distribution of particles for each sample. *p = 0.0112 (Wilcoxon). ns: p > 0.05 (Wilcoxon). Source data provided as Source data file. E Size distribution pre- and post-floatation was unchanged. F Absolute particle concentration (left) and median size (right) measured through light scatter (All) and fluorescence (DiD) mode. Each dot is one measurement and the (mean) SD of n = 3, ns: p > 0.05 (Wilcoxon). Source data provided as Source data file. G THP-1 cells infected for 8 h with L. pneumophila wt or ∆rsmY. Data are presented as (mean) SD of n ≥ 3 independent, biological replicates (p < 0.0001) H) THP-1 incubated 3 h with wt or ∆rsmY Lp-EVs. Data are presented as (mean) SD of n = 5 independent biological replicates. (p < 0.0001). (G + H) Protein quantities of RIG-I and IRAK analyzed by western blot, intensities relative to the non-infected control (NI) and RhoGDI loading control. A two-way ANOVA for statistical analysis was performed. Right, representative western blots. Source data provided as Source data file. I Quantification of RIG-I, IRAK1 and cRel protein levels after transfection of THP-1 with RsmY and tRNA-Phe. Relative mean intensities normalized to non-transfected cells (NT) and RhoGDI loading control. Control RNA (ctrlRNA) average of random L. pneumophila DNA, anti-sense of RsmY or tRNA-Phe. Left, representative blot. Data are presented as (mean) SD of n = 8 independent biological replicates. For statistical analysis a two-way ANOVA was performed with p < 0.05 significant (*), p < 0.01 very significant (**), p < 0.001 extremely significant (***). Source data provided as Source data file. J Representative EMSA (n = 3) of in vitro transcribed RNA.

