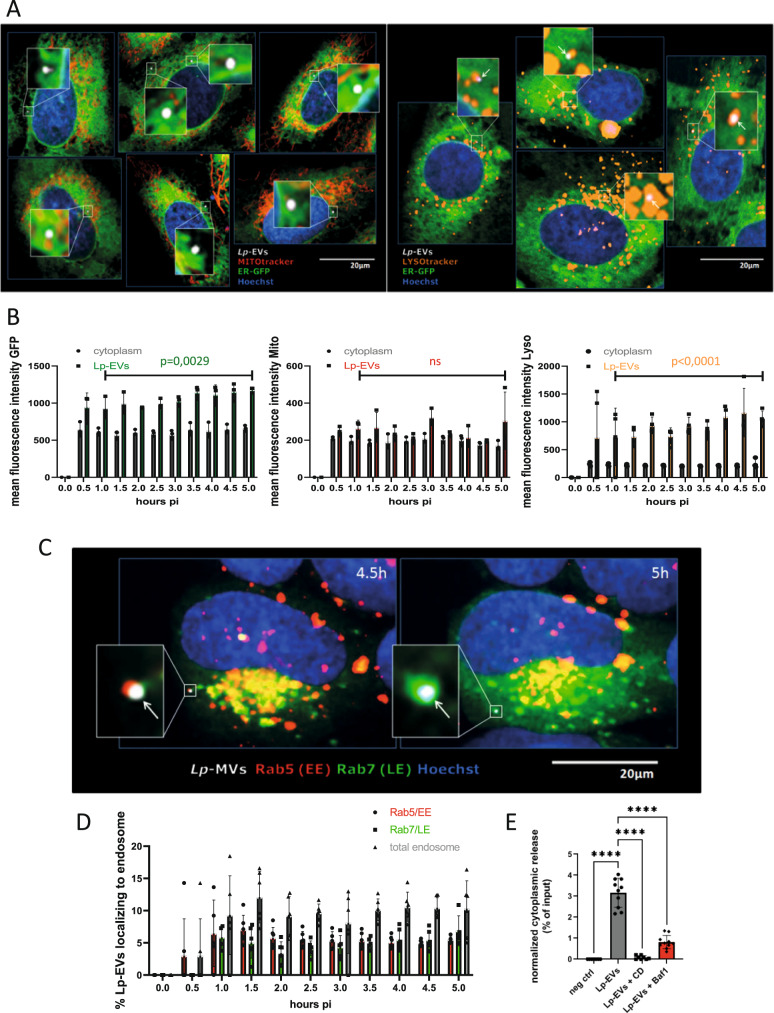
Fig. 3. Internalized Lp-EVs follow the endosomal pathway.
A U2OS-Sec61β cells incubated with DiD-labelled Lp-EVs. Live cell image shows co-localization of Lp-EVs with ER and mitochondria (left and magnifications) and with acidic organelles (right and magnifications). Representative images of n = 3. White: DiD-labelled Lp-EVs; Green: ER; Blue: Nucleus; Red: Mitochondria; Orange: acidic organelles. B Quantification of co-localization events over time. Live cell image acquisition of multiple fields per well of infected U2OS-Sec61β cells was performed on an automated confocal microscope and the mean fluorescence intensity (MFI) of GFP, Mitotracker and Lysotracker, and Lp-EVs was analyzed, suggesting that they co-localize with ER and lysosomes. Data are presented as (mean) SD with each dot representing the mean of up to 600 independently analyzed cells. For statistical analysis an unpaired t-test was performed (two-tailed; p < 0.05 significant). Source data provided as Source data file. C U2OS cells labelled with Rab5 and Rab7 CellLight incubated with DiD-labelled Lp-EVs. Co-localization of Lp-EVs with Rab5+ early endosomes (EE) 4.5 h post-infection and with Rab7+ late endosomes (LE) 5 h post-infection. Live cell image acquisition of multiple fields per well of infected U2OS cells was performed over the time at 37 °C (5% CO2) on an automated confocal microscope. Representative images of five independent experiments. White: DiD-labelled Lp-EVs; Blue: Nucleus; Red: Rab5; Green: Rab7. D Quantification of Lp-EVs co-localizing with EE and LE were determined during 5 h of infection. Data are presented as (mean) SD with each dot representing the mean of around 500 independently analyzed cells. Source data provided as Source data file. E Quantification of purified HiBiT-GroEL EV content delivery within LgBiT-THP-1 acceptor cells, +/− Bafilomycin A1 (BA1) or Cytochalasin D (CD) treatment. Negative control, LgBiT-THP-1 cells incubated with purified Lp-EVs (no HiBiT). The luminescence in the negative control was defined as 0%. Bafilomycin A1 (loss of endosomal acidification) and Cytochalasin D (inhibition of actin polymerization) significantly reduces the content delivery into the host cell. Error bars represent the (mean) SD of at least n = 8 biological repeats. For statistical analysis, a two-way ANOVA analysis was performed with p < 0.0001 (****). Source data provided as Source data file.

