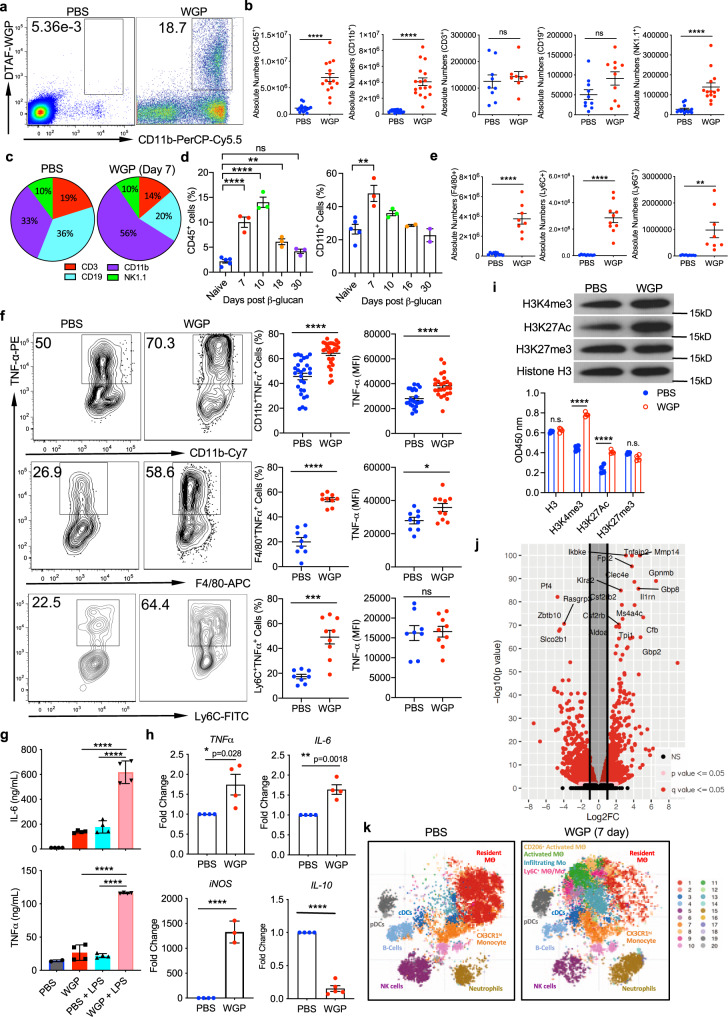
Fig. 2. β-glucan stimulates an influx of trained myeloid cells into the pancreas.
a Percent of CD45+CD11b+DTAF+ cells in the pancreas 3 days after WT mice received I.P. DTAF-WGP. b Seven days after PBS or WGP injection, absolute numbers of CD45+ (n = 15), CD11b+ (n = 18), CD3+ (n = 8), CD19+ (n = 10), and NK1.1+ (n = 14) cells are shown. ****p < 0.0001. c Pie charts representing frequency changes of major immune cell populations after WGP treatment. d WT mice were injected with PBS (n = 5) or WGP (n = 5) and the percent of CD45+ and CD45+CD11b+ cells were measured 7, 10, 18, and 30 days later (n = 3). **p = 0.0034, ****p < 0.0001 (CD45), **p = 0.0023 (CD11b). e Absolute numbers of F4/80+ (n = 10), Ly6C+ (n = 10), and Ly6G+ (n = 8) within the CD11b+ population. **p = 0.003, ****p < 0.0001. f Seven days after IP PBS or WGP the pancreas was restimulated with LPS. TNFα production in CD11b+ (n = 28), CD11b+F4/80+ (n = 9), and CD11b+Ly6C+ (n = 8) cells was measured. *p = 0.024, ***p = 0.0001, ****p < 0.0001. g Seven days after PBS or WGP, the CD45+CD11b+ population was enriched (n = 4). Cells were restimulated with or without LPS for 24 h. TNFα and IL-6 production was measured using ELISA. ****p < 0.0001. h Pancreatic CD11b+ cells from PBS and WGP-trained mice were sorted. RT-qPCR was done to quantify TNFα (n = 4), IL-6 (n = 4), iNOS (PBS n = 4, WGP n = 3), and IL-10 (PBS n = 4, WGP n = 5) mRNA expression levels. *p = 0.028, **p = 0.0018, ****p < 0.0001. i CD11b+ cells from PBS or WGP-injected mice (24 h) were sorted (n = 4). Histones were isolated and subjected to western blot analysis (top) or ELISA (bottom) for H3K4me3, H3K27Ac, H3K27me3, and total H3. ****p < 0.0001. j Seven days after IP WGP or PBS, pancreatic CD45+CD1b+ populations were sorted. RNA-Seq analysis was performed (PBS n = 3, WGP n = 3). The distribution of p values (–log10(p value)) and fold changes (log2 FC) of differentially expressed genes are represented. k t-SNE plots of the CD11b+ population in mice trained with PBS or WGP 7 days prior and analyzed with CyTOF (PBS n = 3, WGP n = 3). Unpaired, two-tailed student’s t-tests were used in b, e, f, and h. A one-way ANOVA with multiple comparisons was used in d, g, and i. Data represented as mean ± SEM. ns not significant. Each sample represents a biologically independent animal obtained over a single independent experiment.

