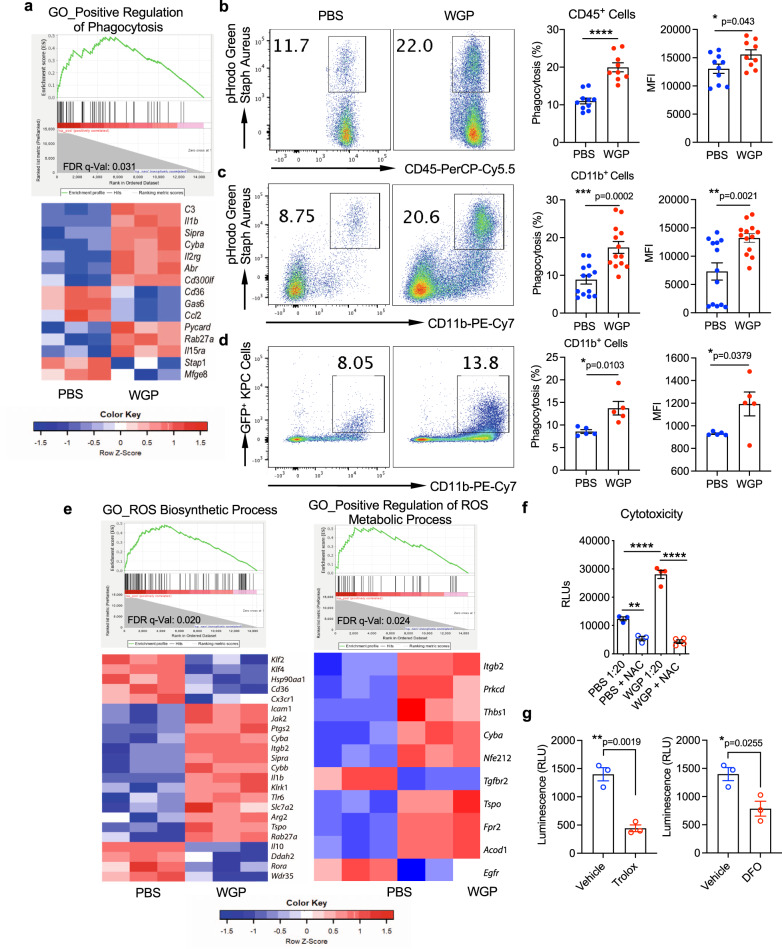
Fig. 5. WGP-trained pancreatic infiltrating myeloid cells show enhanced phagocytosis and ROS-mediated cytotoxicity.
a Enrichment plots (GSEA) and heatmap of genes related to the positive regulation of phagocytosis in CD11b+ cells from 7-day WGP-trained as compared to PBS mice. b The percent of CD45+ pancreatic cells that phagocytosed a pHrodo Green Staph Aureus particle in PBS (n = 10) and 7-day WGP (n = 9) mice along with the MFI of the pHrodo Green Staph Aureus particle. Each dot represents data from one mouse. *p = 0.043, ****p < 0.0001. c The percent of CD11b + myeloid pancreatic cells that phagocytosed a pHrodo Green Staph Aureus particle in PBS (n = 13) and 7-day WGP (n = 13) mice. Cells were first gated on the CD45+ population. The MFI of the pHrodo Green Staph Aureus particle is shown. **p = 0.0021, ***p = 0.0002. d The percent of CD11b+ myeloid pancreatic cells that phagocytosed KPCGFP+ tumor cells in PBS (n = 5) and 7-day WGP (n = 5) mice. *p = 0.0103. Cells were first gated on the CD45+ population. The summarized MFI of the GFP+ signal is also shown. *p = 0.0379. e Enrichment plots (GSEA) and heatmap of genes related to the reactive oxygen species biosynthetic processes and the positive regulation of reactive oxygen species metabolic processes in CD11b+ cells from 7-day WGP-trained as compared to PBS mice. f Summarized results from a cytotoxicity assay where CD11b+ cells from PBS and 7-day WGP-trained mice were sorted and incubated at a ratio of 1:20 KPCLuc+: CD11b+ cells for 24 h. NAC was used to block ROS expression and the tumor cytotoxicity was assessed by luminescence (PBS n = 3, WGP n = 4). g Summarized data from cytotoxicity assays where CD11b+ cells from 7-day WGP-trained mice were sorted and incubated at a ratio of 1:20 KPCLuc+: CD11b+ cells for 24 h. Trolox or DFO or respective vehicle controls were added and tumor cytotoxicity was determined by measuring luminescence (n = 3). *p = 0.0255, **p = 0.0019. An unpaired, two-tailed student’s t-test was used in b–d and g and a one-way ANOVA with multiple comparisons was used for f. Data were represented as mean ± SEM. ns not significant. In b–g, each sample represents a biologically independent animal obtained over a single independent experiment which was repeated at least twice for verification of results.

