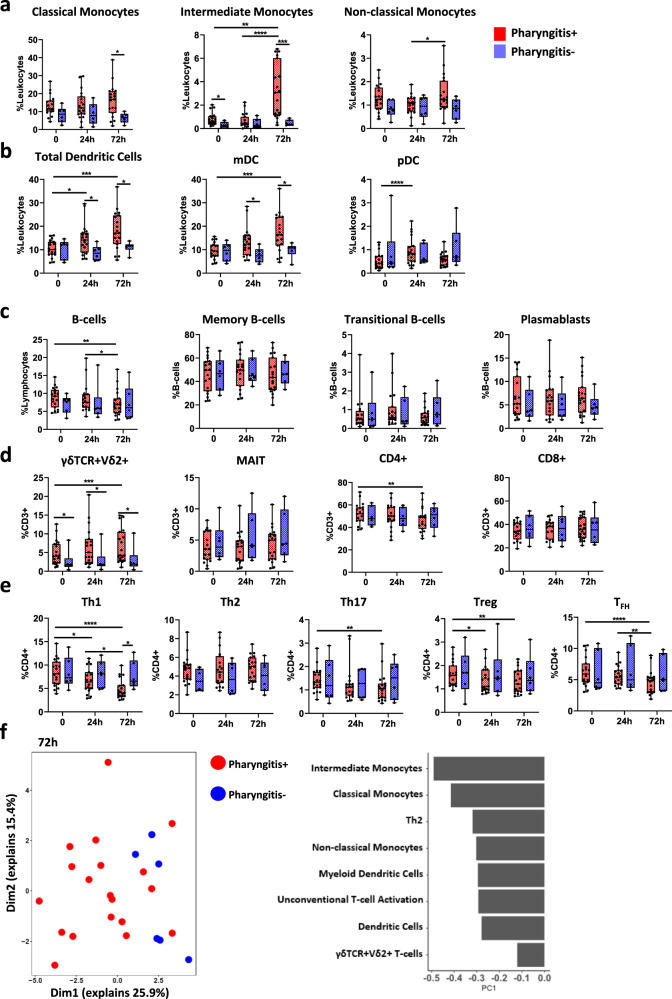
Fig. 3. Unique cellular profiles in participants that developed pharyngitis.
a Differences in monocyte subsets at timepoint 0 h (pre-infection) 24 h post-infection (24 h) and 72 h post-infection (72 h) between pharyngitis positive (n = 19, red) and negative (n = 6, blue) participants. b Dendritic cell subsets. c B cells and B-cell subsets. d γδTCR + Vδ2+ T cells, MAIT cells, CD4+ T cells and CD8+ T cells. e CD4+ T cell subsets. f Unsupervised PCA analysis of cellular subsets between pharyngitis positive and negative individuals at 72 h post-infection and the top 8 factors contributing to differences. Data presented as boxplots show median ± IQR with min–max whiskers. A Friedman’s test was used to compare responses over time in P+ and P− groups, while a Mann–Whitney U-test was performed to compare differences between P+ and P− groups. All tests performed were two-tailed and a p-value <0.05 was considered significant; *p < 0.05, **p < 0.01, ***p < 0.001, ****p < 0.0001.

