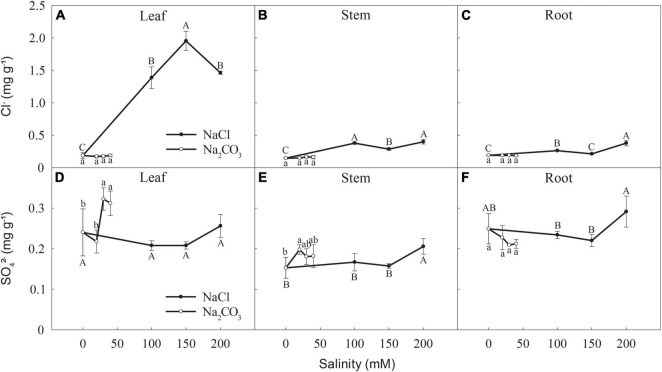
FIGURE 6.
Changes in the concentrations of (A–C) Cl– and (D–F) SO42– in the leaves, stems, and roots of canola seedlings after 7 days of NaCl and Na2CO3 stress. Different uppercase and lowercase letters indicate significant difference among NaCl and Na2CO3 concentrations, respectively, according to a least significant difference (LSD) test (P < 0.05).

