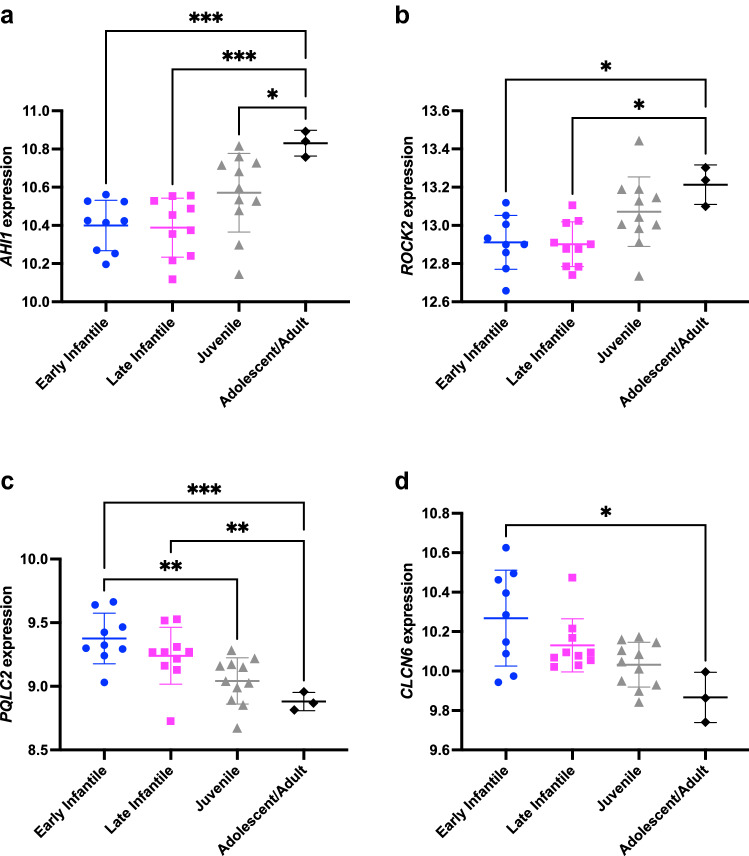
Figure 3.
Gene expression significantly correlates with age of neurological disease onset. Four representative genes with significant correlation with the age of first neurological symptom are shown: (a) AHI1, (b) ROCK2, (c) PQLC2, and (d) CLCN6. The graphs show scatter plots of expression for each gene in each patient (variance stabilized read counts, y-axis) plotted against the age of first neurological symptom for each patient (N = 33). Patients are divided into four groups based on age of onset categories that have been previously described86, as follows: early infantile (2 months–2 years, N = 9), late infantile (3–6 years, N = 10), juvenile (7–15 years, N = 11), and adolescent/adulthood (> 15 years, N = 3). AHI1 and ROCK2 show direct correlation with age of first neurological symptom, while PQLC2 and CLCN6 show inverse correlation. Gene expression values are significantly different across age groups, as calculated by Welch ANOVA (p < 0.05 for all genes) followed by Dunnett’s multiple comparisons test (p values as indicated; *p < 0.05, **p < 0.01, ***p < 0.001).

