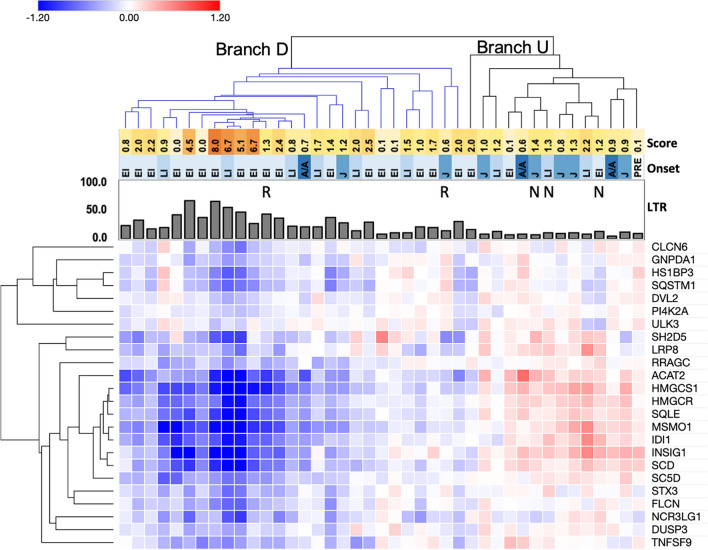
Figure 5.
Hierarchical clustering reveals reduced expression of genes following HPβCD treatment in a subset of NPC1 patients. Heatmap values are the difference between variance stabilized read counts for cells after HPβCD treatment and for untreated cells (ΔHPβCD). Heatmap colors indicate reduced expression following HPβCD treatment (blue), unchanged expression (white), and increased expression following HPβCD treatment (red). This figure displays clustering of a subgroup of 24 genes that showed reduced expression; hierarchical clustering of ΔHPβCD values for all significantly correlated genes is shown in Supplementary Fig. 2. Branch D and Branch U are the two main dendrogram branches for patient cell lines identified by clustering analysis. Branch D (downregulated, blue color) includes cell lines with broadly reduced levels of the notable gene cluster; Branch U (upregulated/unchanged) contains the remaining cell lines with unchanged or upregulated levels of this gene cluster. R = responder, N = non-responder; these labels refer to patients who were identified in a previously reported clinical trial to show phenotypic stability/improvement in response to HPβCD treatment or no improvement, respectively26. Score: neurological severity scores for each patient are shown in the yellow to orange heatmap, with darker colors indicating higher scores/greater severity. Onset: age of onset (visceral or neurological) is shown in the blue heatmap, with darker blues indicating older ages (EI = early infantile, LI = late infantile, J = juvenile, A/A = adolescent/adult, PRE = presymptomatic). The bar graph indicates LysoTracker levels (LTR) in untreated fibroblasts.

