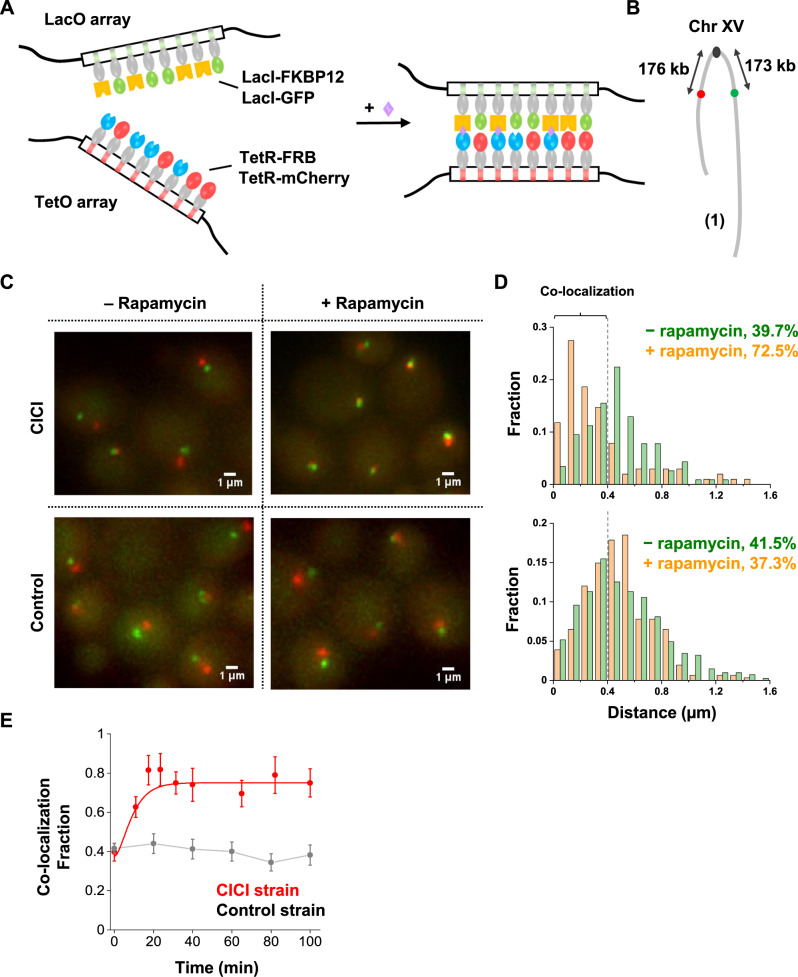
Fig. 1. Implementation of CICI.
A The scheme of CICI. LacO and TetO arrays were inserted into two genomic loci. Fusion proteins LacI-FKBP12 and TetR-FRB associated with these arrays dimerize in the presence of rapamycin. LacI-GFP and TetR-mCherry were also included for visualization. B LacO (green dot) and TetO (red dot) arrays are integrated 150 kb from the centromere on the left and right arms of Chr XV. C Visualization of the CICI strain (containing the complete CICI system in (A)) and the control strain (containing LacI and TetR instead of LacI-FKBP12 and TetR-FRB) ± rapamycin. D Histograms of distances between the two dots in the CICI strain (upper panel) and in the control strain (lower panel) ± rapamycin. The +rapamycin histogram includes measurements where the CICI or control strains were incubated with rapamycin for 1–2 h. In total, 116, 102, 407, and 308 cells were measured, respectively. The co-localization fraction in each condition is shown in the plots. E Fraction of co-localization as a function of rapamycin incubation time in the CICI (red) or the control strain (black). The total numbers of data points were 436 for CICI and 912 for control. Data are presented as mean values ± SEM. Source data for D and E are provided as a Source Data file.

