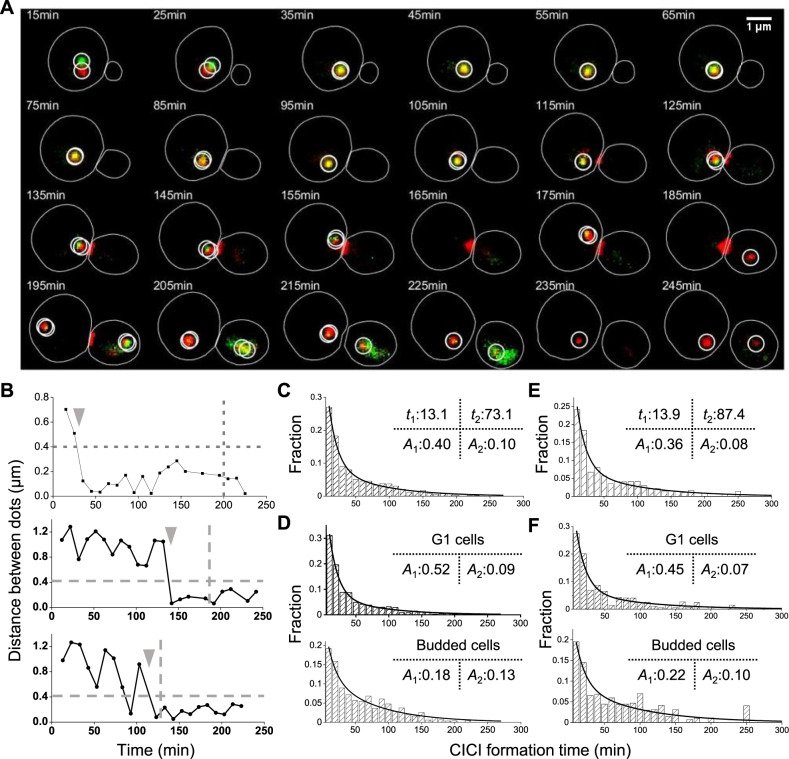
Fig. 3. CICI formation in real time.
A Example time-lapse images of CICI strain (pair 5). The chromatin dots at the LacO and TetO arrays are circled. The budneck is labeled with Myo1-mCherry. B Distance between LacO and TetO arrays as a function of time in three cells. The upper panel is derived from the mother cell in (A). The horizontal line represents the co-localization threshold (0.4 µm), and the vertical lines show the time of cell division. The gray arrows point to the CICI formation time in these three single cells. C Histogram of CICI formation time for all cells (LacO and TetO pair 5, N = 773). The histogram is fitted with double exponential curves, and the time constants and amplitudes of the two phases (t1, t2, A1, and A2) are shown. D Histogram of CICI formation time for cells divided into two different cell cycle stages (N = 480 and 255 for G1 and budded cells, respectively). The double exponential fit has the same t1 and t2, but different A1 and A2. E, F Same as C and D, except that LacO and TetO arrays are placed on the two sides of the nucleolus (pair 4). N = 378, 220, 135 for all cells, G1 cells and budded cells, respectively. Source data for B–F are provided as a Source Data file.

