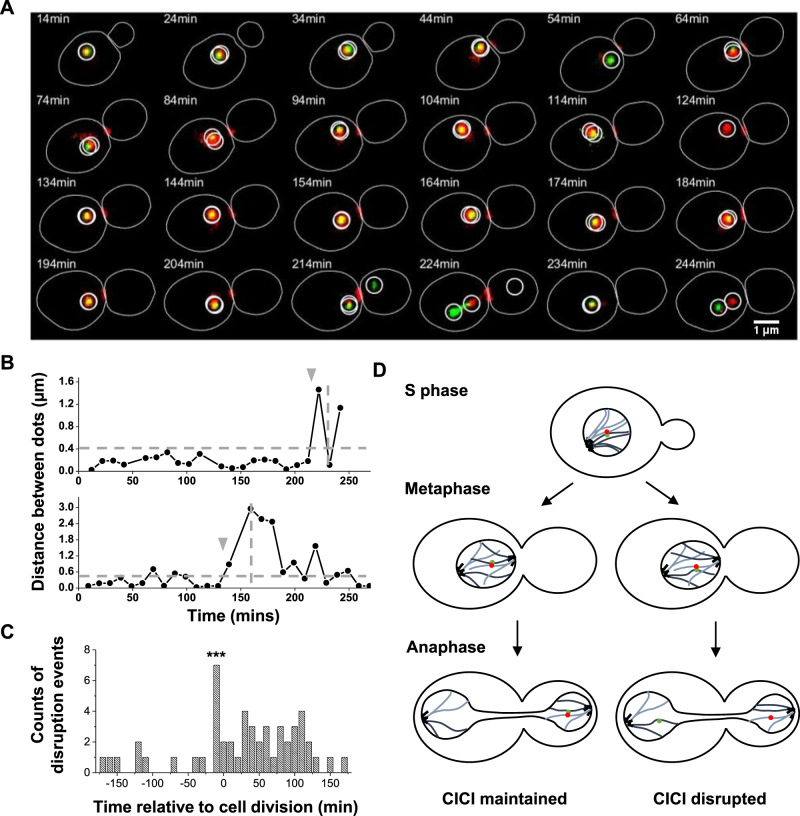
Fig. 4. CICI is disrupted shortly before cell division in a fraction of cells.
A Example time-lapse images of CICI strain (pair 5) that show CICI disruption near the end of the cell cycle. B Distance between LacO and TetO arrays as a function of time in two cells. The upper panel is derived from the mother cell in (A). The horizontal line represents the co-localization threshold (0.4 µm), and the vertical lines show the time of cell division. The gray arrows point to the time of CICI disruption. C Histogram of the time of CICI disruption relative to the end of the cell cycle (total CICI disruption events N = 36). The seven disruption events near the end of the cell cycle are statistically significant (one-sided Student’s t-test, P value < 0.001). D Model of CICI disruption during anaphase. For clarity, only one of the two CICI pairs is shown in these cells. Source data for B and C are provided as a Source Data file.

