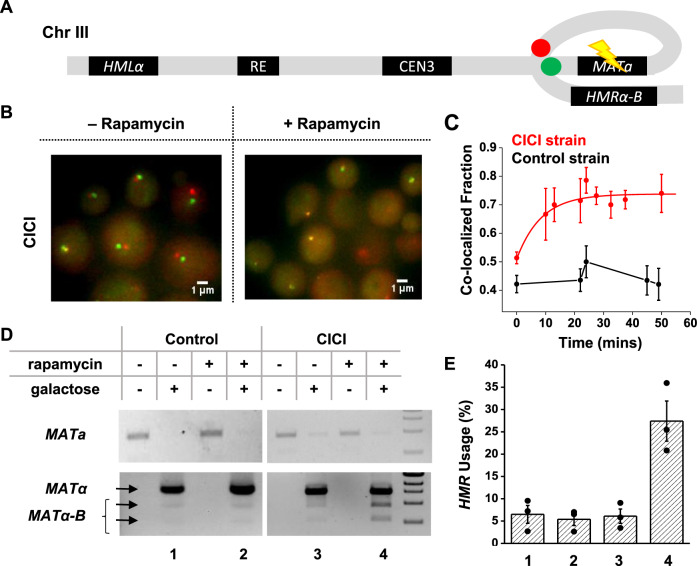
Fig. 5. CICI affects the donor preference in homology-directed DNA repair.
A Engineered proximity between MATa and HMRα-B by CICI. Green and Red dots: LacO and TetO arrays; Flash symbol: HO digestion. B Visualization of the MATa and HMRα-B loci ± rapamycin. C Fraction of co-localization as a function of rapamycin incubation time in the CICI (red) or the control strain (black) used in the mating-type switching assay. The total numbers of data points were 226 for the CICI strain and 272 for the control. Error bars represent standard error in the fraction. D Quantitative analysis of HMR usage in yeast mating-type switching. Top gel: PCR of the MATa sequence, which decreases after the HO induction (representing the switching from a to α or α-B). Bottom gel: PCR of the MATα sequence followed by BamHI digestion. Undigested (top arrow)/digested bands (bottom two arrows) represent the usage of HML (α) and HMR (α-B). 1 kb DNA ladder is shown on the right. E The fraction of HMR usage for the four conditions in D, which was calculated as the sum intensity of the lower two bands divided by the sum intensity of all three bands. Data are presented as mean values ± SEM from three biological repeats. Source data for C–E are provided as a Source Data file.

