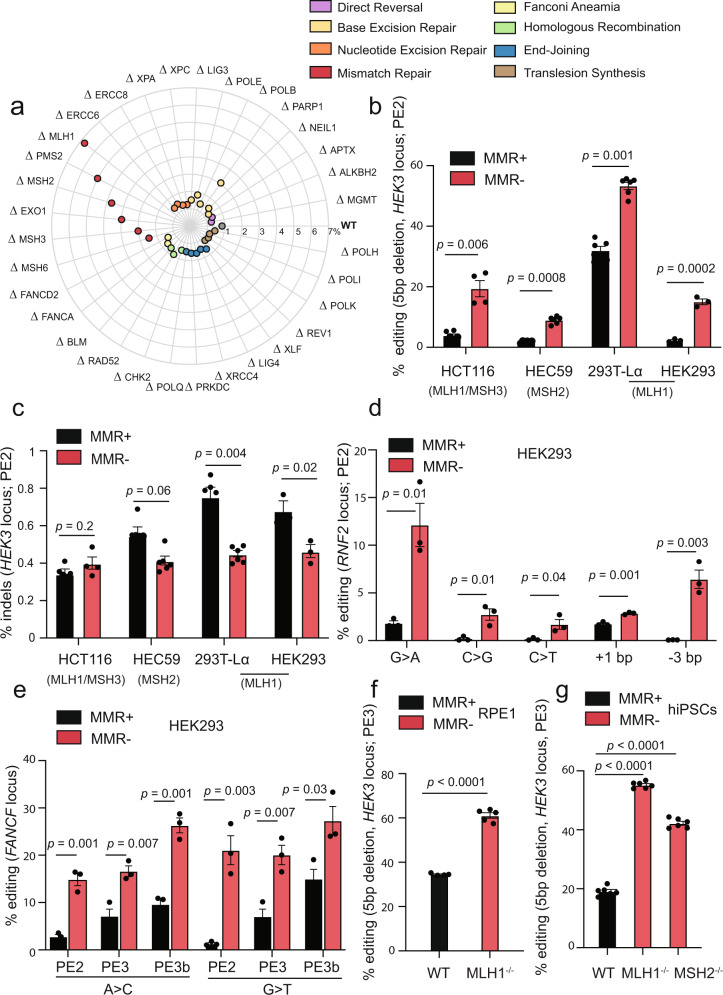
Fig. 1. Mismatch repair inhibits prime editing in human cells.
a Genetic screen in 32 HAP1 isogenic knockout cell lines covering different DNA damage repair pathways, as well as their wild-type (WT) counterpart. Efficiency of installation of a five base pair (bp) deletion in the HEK3 locus, using PE2 for n = 2 biologically independent experiments. Each radial line represents an increment of 1%. b PE2 of a 5 bp deletion in the HEK3 locus in the indicated mismatch repair-deficient cell lines (MMR−), and their respective complemented counterparts (MMR+). For each cell line, the mutated MMR genes are represented. Editing efficiency measured for n = 3 biologically independent experiments (with technical replicates also depicted). c Percentage of indels after a 5 bp deletion in the HEK3 locus using PE2 in varying mismatch repair-deficient (MMR−), and their respective complemented, cell lines (MMR+), for n = 3 biologically independent experiments (with technical replicates also depicted). For each cell line, the correspondent mutated MMR gene is indicated. d PE2 of the indicated types of edits (RNF2 locus) in HEK293 cells wild-type (MMR+), or knockout for MLH1 (MMR−). Values correspond to editing efficiency, measured for n = 3 biologically independent experiments. e Efficiency of PE2, PE3, and PE3b after inducing A>C or G>T mutations in the FANCF locus. HEK293 wild-type (MMR+) and MLH1 knockout cells (MMR−) were used. Editing efficiency for n = 3 biologically independent experiments. f PE3 efficiency of a 5 bp deletion in the HEK3 locus in RPE1 wild-type (WT) cells and an isogenic knockout MLH1 cell line (RPE1-MLH1−/−), determined by Sanger sequencing and TIDE analysis, for n = 3 biologically independent experiments (technical replicates also depicted). RPE1 cells express Cas9(H840A)-RT in a constitutive manner (RPE1 PE2-BSD). g PE3 efficiency in wild-type (WT) human induced-pluripotent stem cells (hiPSCs), and isogenic knockouts for MLH1 and MSH2 (MLH1−/−, MSH2−/−), for n = 3 biologically independent experiments (technical replicates also depicted). Statistical analysis performed using unpaired two-tailed Student’s t-test across biological replicates only. Error bars reflect mean ± s.e.m. Source data are provided as a Source Data file.

