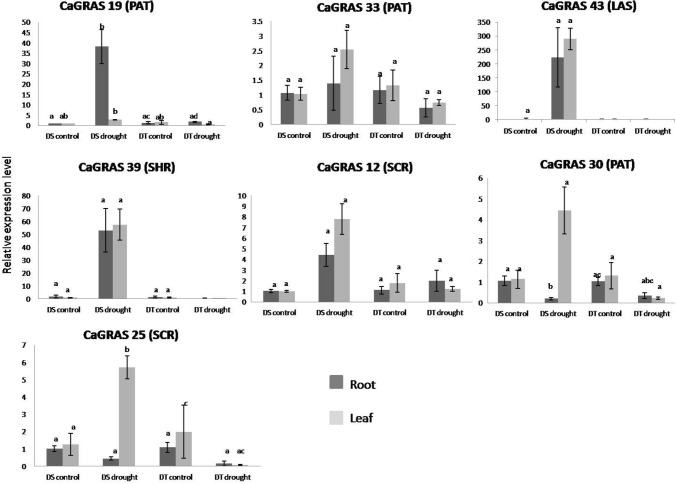
Fig. 13.
Gene expression patterns of 7 CaGRAS genes in leaf and root tissues, estimated by qRT-PCR analysis for the DT: drought tolerant variety; DS: drought sensitive variety. The relative expression levels which were normalized to GAPDH were determined by the comparative CT method (2 − ΔΔCT). Three biological and technical replicates were used for each experiment. Error bars indicate standard errors of means. The different letters above each column represent significant difference at p < 0.05

