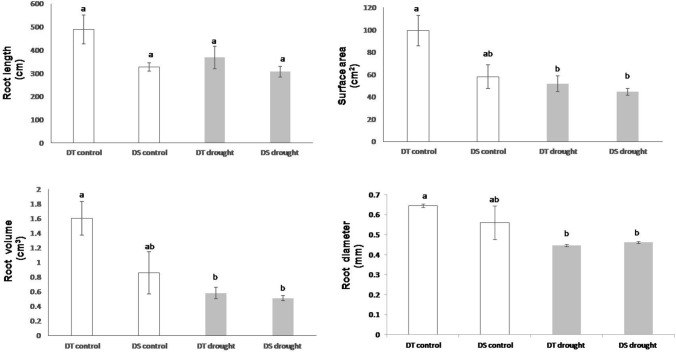
Fig. 2.
Differences in root morphological characters in control and treated plants, in response to drought stress conditions, for the two genotypes ICC 4958 (DT) and ICC 1882 (DS). Error bars indicate standard errors of means of five biological replicates. Statistical significance was tested by one-way ANOVA followed by Tukey’s post hoc test. The different letters above each column represent significant difference at p < 0.05

