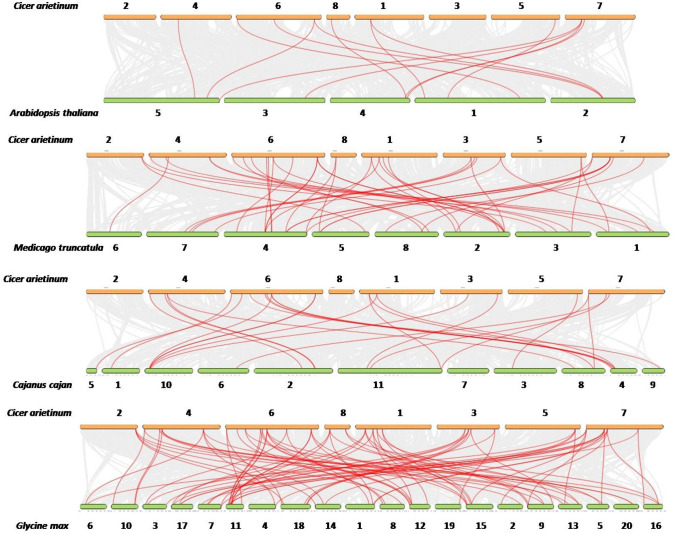
Fig. 5.
Synteny analyses of the GRAS genes between chickpea and A. thaliana, M. truncatula, C. cajan and G. max. The collinear blocks between genomes are depicted by the gray lines. The syntenic GRAS gene pairs are highlighted with the red lines. The numbers indicate the chromosome numbers in the genomes

