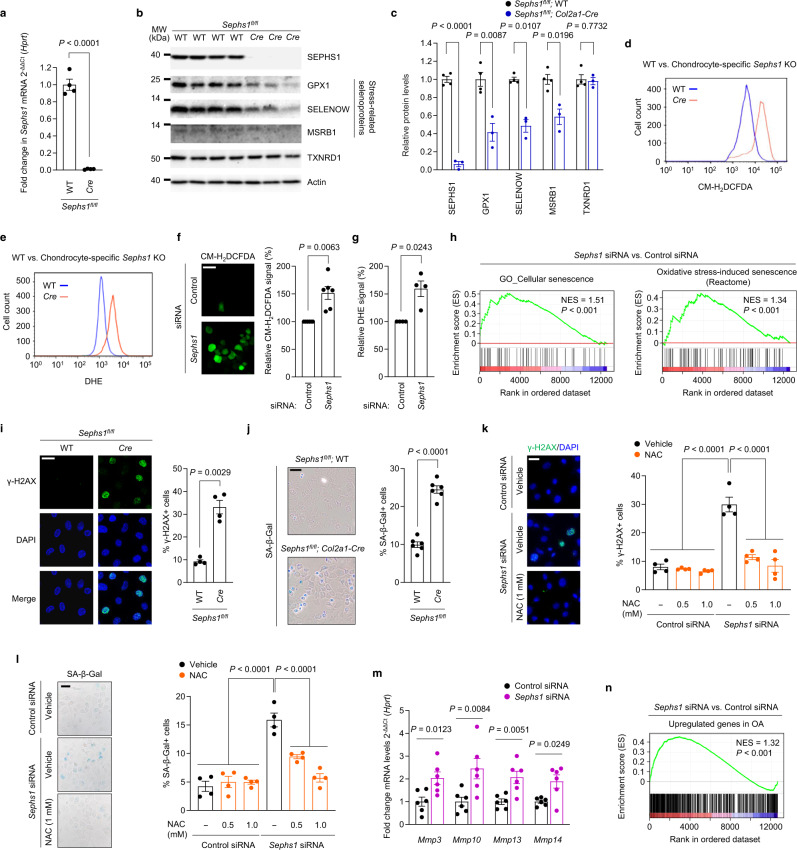
Fig. 2. Downregulation of SEPHS1 in OA cartilage leads to oxidative stress-induced cellular senescence in chondrocytes.
a Relative mRNA expression level of Sephs1 in primary cultured chondrocytes isolated from Sephs1fl/fl or Sephs1fl/fl; Col2a1-Cre mice (n = 4). b Western blot analysis of selenoproteins in primary cultured chondrocytes isolated from Sephs1fl/fl (n = 4) and Sephs1fl/fl; Col2a1-Cre mice (n = 3). c Quantification of protein levels in (b) (n = 4, 3 respectively). d, e Fluorescence-activated cell sorting (FACS) analysis of d CM-H2DCFDA and e DHE fluorescence in primary cultured chondrocytes isolated from Sephs1fl/fl and Sephs1fl/fl; Col2a1-Cre mice. f, g Immunofluorescence staining and quantification of f CM-H2DCFDA (n = 6) and g DHE (n = 4) fluorescence in chondrocytes transfected with negative control siRNA or siRNA targeting Sephs1. h GSEA of ‘Cellular senescence’ and ‘Oxidative stress-induced senescence’ gene sets in chondrocytes transfected with negative control siRNA or siRNA targeting Sephs1. i Immunofluorescence staining of γ-H2AX and quantification of γ-H2AX positivity in primary cultured chondrocytes isolated from Sephs1fl/fl and Sephs1fl/fl; Col2a1-Cre mice (n = 4). j SA-β-Gal staining and quantification of SA-β-Gal positivity in primary cultured chondrocytes isolated from Sephs1fl/fl and Sephs1fl/fl; Col2a1-Cre mice (n = 6). k, l Quantification of k immunofluorescence positivity of γ-H2AX and l SA-β-Gal positivity in primary cultured chondrocytes transfected with negative control siRNA or siRNA targeting Sephs1 followed by NAC treatment at the indicated doses (n = 4). m Relative mRNA expression of SASP factors in chondrocytes transfected with negative control siRNA or siRNA targeting Sephs1 (n = 6). n GSEA of the ‘Upregulated genes in OA’ gene set in chondrocytes transfected with negative control siRNA or siRNA targeting Sephs1. Scale bars: f, i, k 25 μm, j, l 50 μm. a, c, f, g, i–m Data represent means ± s.e.m. P values are from two-tailed t test (a, c, f, g, i, j, m) or two-way ANOVA followed by Dunnett’s post-hoc test (k, l). For GSEA plots in h, n, enrichment plots are displayed with the determined nominal P value and normalized enrichment score (NES). Unprocessed immunoblot images are provided in Supplementary Fig. 10.

