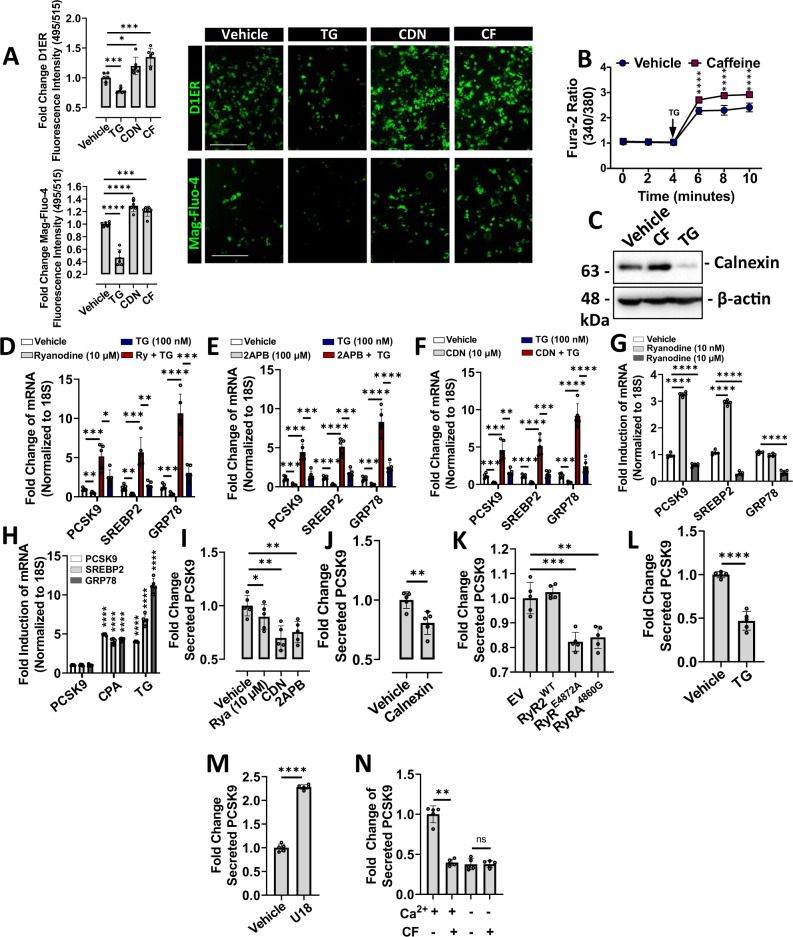
Fig. 3. Endoplasmic reticulum Ca2+ modulates PCSK9 expression and secretion.
A HuH7 cells were either transfected with a FRET-based ER-resident Ca2+ sensor, D1ER, or pre-loaded with the low-affinity Ca2+ indicator, Mag-Fluo-4 (green color). Cells were subsequently treated with either thapsigargin (TG; 100 nM), CDN (100 µM) or caffeine (CF; 200 µM) for 24 h. Fluorescence intensity was measured using a fluorescent spectrophotometer and visualized using a fluorescent microscope (n = 6 biologically independent samples per group; data presented are mean ± s.d.). B HuH7 cells were pre-treated with either CF or vehicle for 24 h and loaded with the high-affinity Ca2+ dye, Fura-2-AM. Exposure of cells to a high dose of TG (1 mM) induced a spontaneous depletion of endoplasmic reticulum (ER) Ca2+ (*, p < 0.05 vs. vehicle-treated). C The expression of an ER-resident Ca2+ binding protein, calnexin, was examined in CF- and TG-treated HuH7 cells using immunoblots. D–G PCSK9, SREBP2, and GRP78 mRNA expression was assessed in HuH7 cells treated with a variety of ER Ca2+ modulators including: ryanodine receptor agonist (ryanodine, 10 nM), ryanodine receptor antagonist (ryanodine, 10 µM), SERCA pump activator CDN (100 µM) and IP3R antagonist 2APB (50 µm), in the presence and absence of TG (100 nM) for 24 h. H mRNA transcript levels were also examined in HuH7 cells treated with SERCA pump inhibitors, TG (100 nM), and CPA (10 µM). I–K The effect of pharmacologic agents and plasmid-derived CMV-driven proteins, known to affect ER Ca2+ levels, on secreted PCSK9 levels was then examined using ELISAs. L, M Secreted PCSK9 levels were also examined in TG- and U18-treated cells. N The effect of CF on secreted PCSK9 levels was also examined in cells incubated in Ca2+-deficient medium. For panels D–N: n = 5 biologically independent samples per group; data presented are mean ± s.d. Scale bars; 200 µm. Statistical comparisons between two groups were conducted using unpaired two-tailed Student’s t-tests, while multiple groups were compared using one-way ANOVAs with the Tukey HSD post hoc test (*p < 0.05; **p < 0.01; ***p < 0.001; ****p < 0.0001). Source data are provided as a Source Data file.

