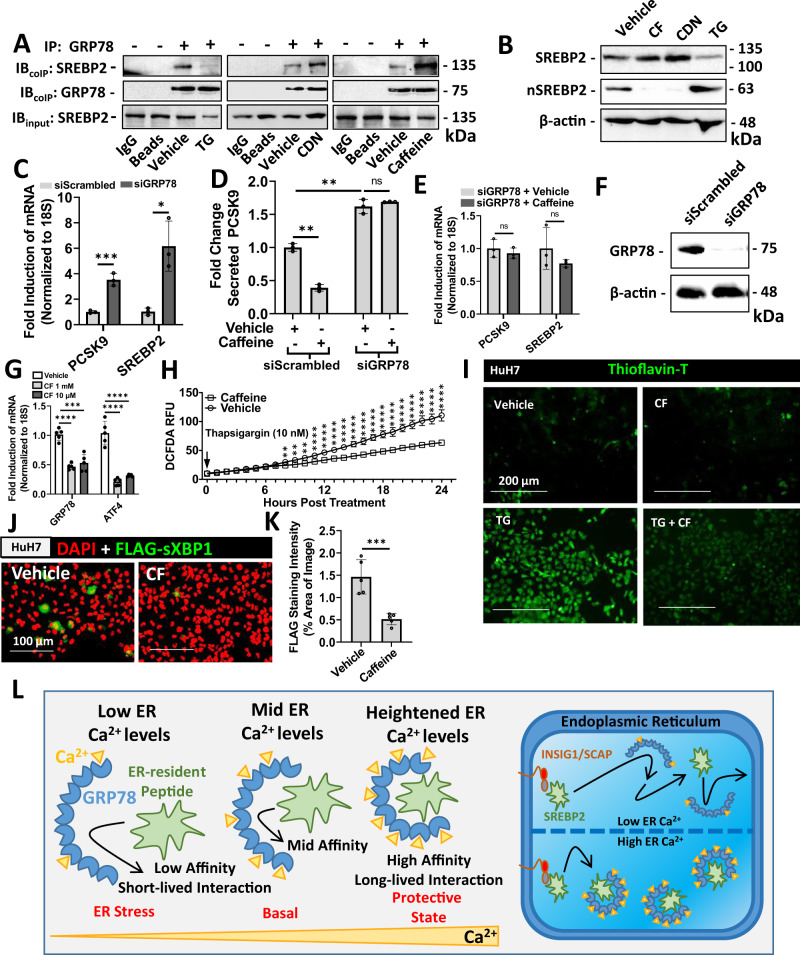
Fig. 4. Endoplasmic reticulum Ca2+ regulates the interaction between GRP78 and SREBP2.
A HuH7 cells were treated with control agents thapsigargin (TG; 100 nM), which causes ER Ca2+ depletion, or CDN (100 µM), a compound known to increase endoplasmic reticulum (ER) Ca2+ levels. The effect of caffeine (CF; 200 µM) was also assessed. Following 24 h treatment, a co-immunoprecipitation (IP) for GRP78 was carried out. Protein loading was normalized to GRP78 and relative co-immunoprecipitated SREBP2 was examined via immunoblots (IB). B The effect of CF, CDN, and TG on the retention of ER-resident pre-mature SREBP2, and on the activated nuclear SREBP2 (nSREBP2), was also assessed via IB. (C-E) To confirm the role of GRP78 in CF-mediated PCSK9 inhibition, mRNA transcript and secreted protein levels were examined in HepG2 cells exposed to siRNA targeted against GRP78 (siGRP78) (n = 3 biologically independent samples per group; data presented are mean ± s.d.). F Knockdown of GRP78 was confirmed via IB. G ER stress markers were assessed in primary human hepatocytes (PHH) treated with CF (200 µM) and CDN (10 µM) via real-time PCR (n = 5 biologically independent samples per group; data presented are mean ± s.d.). H The effect of CF on reactive oxygen species production, resulting from the treatment of TG (100 nM), was also assessed in HuH7 cells (n = 3 biologically independent samples per group; data presented are mean ± s.d.). I ER stress-induced amyloid deposition was examined using the fluorescent stain, Thioflavin-T (green color). J, K HuH7 cells were transfected with the ER activated indicator plasmid encoding an ER stress-inducible FLAG-sXBP1 (green color; n = 5 biologically independent samples per group; data presented are mean ± s.d.). Staining intensity was quantified using ImageJ software. L Model in which Ca2+ promotes the GRP78-mediated sequestration of SREBP2 in the ER. Statistical comparisons between two groups were conducted using unpaired two-tailed Student’s t-tests, while multiple groups were compared using one-way ANOVAs with the Tukey HSD post hoc test (*p < 0.05; **p < 0.01; ***p < 0.001; ****p < 0.0001). Source data are provided as a Source Data file.

