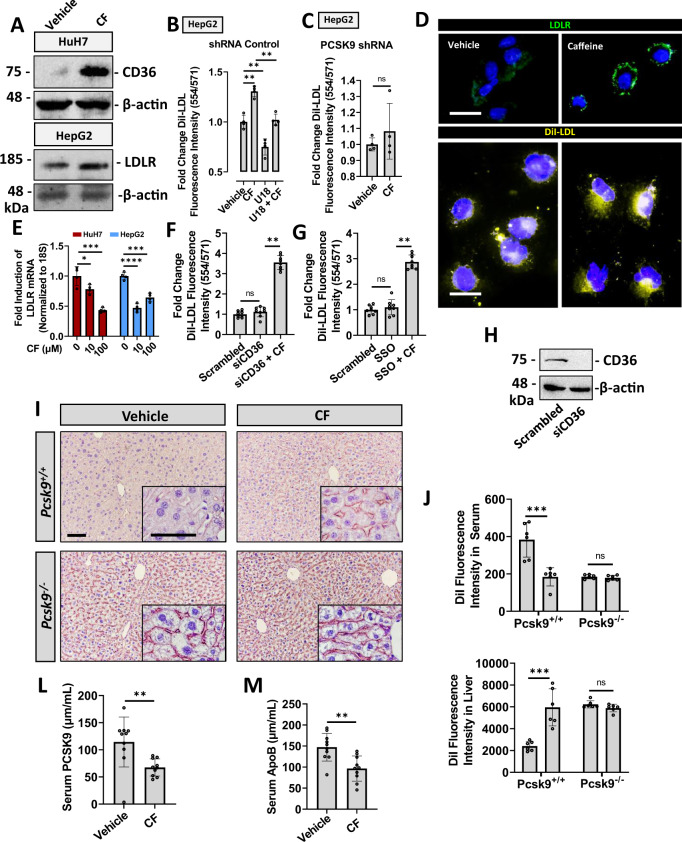
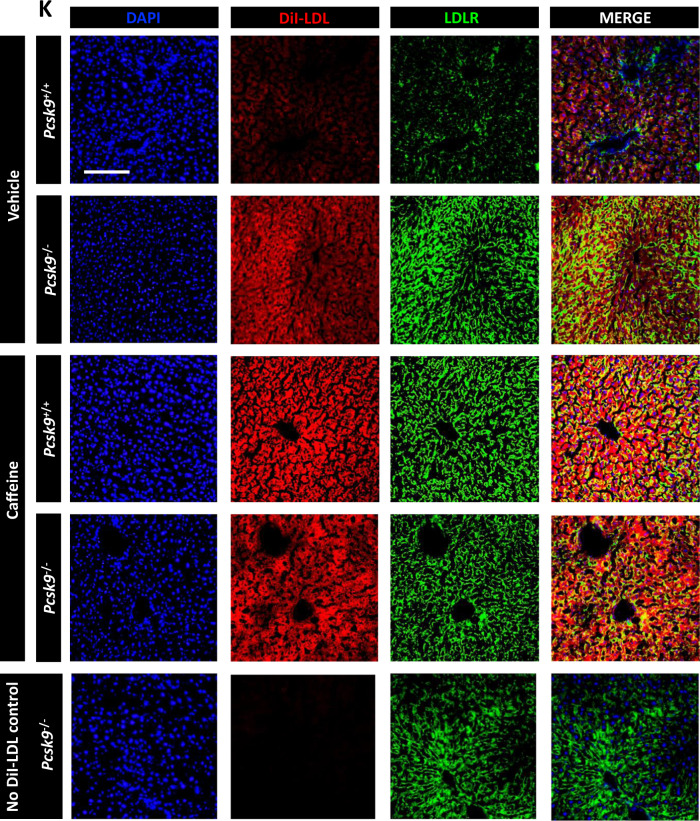
Fig. 6. Caffeine increases hepatic LDL uptake in a PCSK9-dependent manner.
A The expression of PCSK9-regulated receptors, LDLR and CD36, was examined in caffeine (CF)-treated cultured hepatocytes (200 µM). B The uptake and intracellular accumulation of fluorescently labeled DiI-LDL was examined in cells treated with CF in the presence or absence of the PCSK9-inducer, U18, using a fluorescent spectrophotometer (n = 4 biologically independent samples per group; data presented are mean ± s.d.). C The effect of CF treatment (200 µM) on DiI-labeled LDL uptake was also examined in PCSK9 shRNA knockdown cells (n = 4 biologically independent samples per group; data presented are mean ± s.d.). D Immunofluorescent staining of cell-surface LDLR was carried out in live CF pre-treated HepG2 cells (200 µM). Cellular DiI-LDL accumulation was also visualized in CF-treated HepG2 cells using a fluorescent microscope. E Expression of the LDLR in CF-treated HuH7 and HepG2 cells was measured via real-time PCR (n = 4 biologically independent samples per group; data presented are mean ± s.d.). F–G The uptake of DiI-LDL was quantified in HepG2 cells transfected with siRNA targeted against CD36 and a pharmacologic inhibitor of CD36 (SSO) (10 µM) (n = 8 biologically independent samples per group; data presented are mean ± s.d.). H Knockdown was confirmed via immunoblotting. Pcsk9+/+ and Pcsk9−/− mice were treated with either PBS-vehicle or CF, as well as fluorescently labeled DiI-LDL (1 µg/kg). I–K Hepatic cell-surface LDLR expression was assessed via immunohistochemistry (DAPI: blue; LDLR: green; DiI-LDL: red). J Hepatic and serum DiI-LDL fluorescence intensity was quantified using a fluorescent spectrophotometer and visualized using a fluorescent microscope (n = 6 biologically independent samples per group; data presented are mean ± s.d.). L, M Native LDLc was also examined in 18-week-old male C57BL/6J mice treated with CF (30 mg/kg) every 24 h for 14 days via ELISA of the surrogate marker ApoB; serum PCSK9 levels were also assessed via ELISA (n = 10 biologically independent samples per group; data presented are mean ± s.d.). Scale bars; D 10 µm; I 50 µm; K 100 µm. Statistical comparisons between two groups were conducted using unpaired two-tailed Student’s t-tests, while multiple groups were compared using one-way ANOVAs with the Tukey HSD post hoc test (*p < 0.05; **p < 0.01; ***p < 0.001; ****p < 0.0001). Source data are provided as a Source Data file.


