Fig. 3.
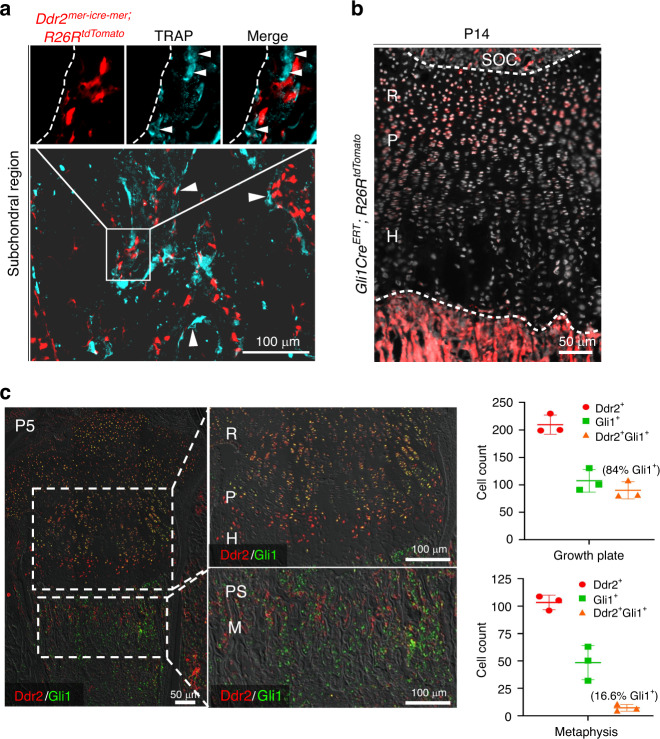
Ddr2-derived cells are distinct from osteoclasts; overlapping distribution of Ddr2 and GLI1. a Fluorescence-based TRAP staining on frozen sections from Ddr2mer-iCre-mer; R26RtdTomato mice at P14 showing no overlap between TRAP+ osteoclasts and Ddr2 tdTomato-labeled cells or their progeny. Scale bar: 50 μm. Arrowheads indicate multinucleated osteoclasts (Cyan). Dotted Line denotes trabecular bone surface. The boxed region is shown in higher magnification (top). b Gli1-CreERT; R26RtdTomato mice were treated with tamoxifen as in Fig. 2a and examined at P14. Section of the proximal tibia showing Gli1-CreERT fluorescent tdTomato fluorescence with intense labeling in the resting zone of the growth plate and primary spongiosa, in cell populations having partial overlap with Ddr2mer-iCre-mer Ddr2-positive cells in Fig. 2. Scale bar: 100 μm. c IF colocalization of Ddr2 (red) and Gli1 (green). Proximal tibias were isolated from P5 C57BL6 mice. Extensive Gli1 and Ddr2 colocalization were seen in the resting zone (R) and proliferative (P) chondrocytes with low staining in hypertrophic cells (H). More limited staining was seen in select cells in primary spongiosa (PS) and metaphysis (M). Right panels, Quantitation of Ddr2+, Gli1+, and Gli1+ Ddr2+ cells in growth plate and PS/MS. The percentage of Gli1+ cells also containing Ddr2 is shown in brackets. Values are means ± SD with n = 3 mice

