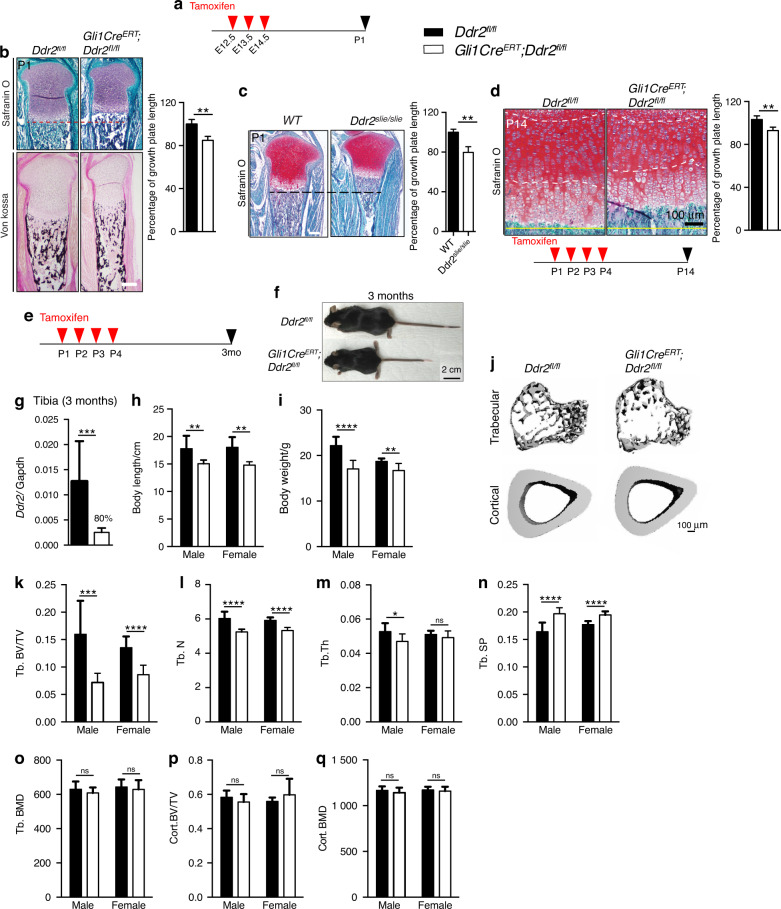
Fig. 4.
Requirement for Ddr2 in Gli1-positive chondro-osteoprogenitors. a Experimental protocol for embryonic study (b). b Safranin O and von Kossa staining of tibia from Ddr2fl/fl (n = 3) and Gli1-CreERT;Ddr2fl/fl (n = 4) newborns. von Kossa staining (lower panel) shows no evident difference in mineralization (black staining). Scale bar: 200 μm. Right; quantification of growth plate length. c Safranin O staining of proximal tibia growth plates from WT and Ddr2Slie/Slie newborns. The dotted line indicates the growth plate lengths of mutant in relation to WT. Scale bar: 200 μm. Right; quantification of growth plate length (n = 3). d Safranin O staining and quantification (right) showing reduced growth plate lengths in mutant mice at 2 weeks of age (n = 3), experimental protocol at the bottom. Scale bar: 100 μm. e Experimental protocol for adult study. f Gross phenotype of 3 month-old Ddr2fl/fl and Gli1-CreERT;Ddr2fl/fl littermates. Gli1-CreERT;Ddr2fl/fl mice have skeletal dwarfism (n = 20, 10 mice/sex). Scale bar, 2 cm. g Gene expression analysis of Ddr2 from whole 3 month-old tibiae to confirm knockout efficiency (n = 6 mice). h, i Body length (cm) and weight (g) measurements (n = 20, 10 mice/sex). j 3D micro-computed tomography (microCT) models of the tibial metaphysis and cortical mid-shaft in 3 month-old Ddr2fl/fl and Gli1-CreERT;Ddr2fl/fl mice. Scale bar 100 µm. k–o Quantification of trabecular bone volume fraction (Trab. BV/TV), trabecular number (Tb.N), trabecular thickness (Tb.Th), trabecular spacing (Tb.Sp), and bone mineral density (Trab. BMD). (n = 20, 10 mice/sex). p, q Quantification of cortical bone volume fraction (Cort. BV/TV), and bone mineral density (Cort. BMD). Statistics: Data are expressed as mean ± SD. Unpaired t-test, *P < 0.05, **P < 0.01; ***P < 0.001; ****P < 0.000 1; ns, not significant

